
House Prices in YO15
House prices in YO15 have an overall average of £217,675 over the last year.
The majority of properties sold in YO15 during the last year were semi-detached properties, selling for an average price of £220,678. Detached properties sold for an average of £330,401, with terraced properties fetching £165,741.
Overall, the historical sold prices in YO15 over the last year were 5% up on the previous year and similar to the 2023 peak of £216,110.
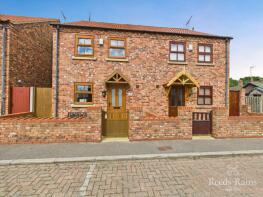
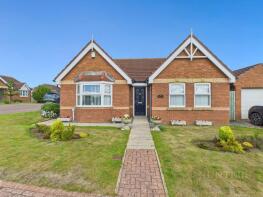
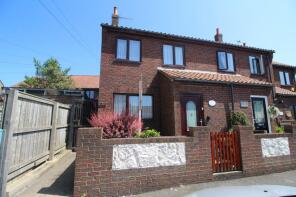
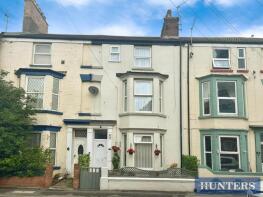
Properties Sold
2a, St Georges Avenue, Bridlington YO15 2ED
| Today | See what it's worth now |
| 27 Apr 2026 | £205,000 |
| 11 Feb 2021 | £140,000 |
104a, Constable Road, Bridlington YO15 1NW

| Today | See what it's worth now |
| 16 Apr 2026 | £188,000 |
| 11 May 2001 | £53,000 |
Flat 2, 8, Vernon Road, Bridlington YO15 2HQ
| Today | See what it's worth now |
| 15 Apr 2026 | £74,000 |
| 27 Jun 2014 | £72,000 |
Extensions and planning permission in YO15
See planning approval stats, extension build costs and value added estimates.

Flat 2, 8, Swanland Avenue, Bridlington YO15 2HH
| Today | See what it's worth now |
| 15 Apr 2026 | £44,000 |
| 13 Mar 2015 | £38,000 |
38, Roundhay Road, Bridlington YO15 3JY
| Today | See what it's worth now |
| 8 Apr 2026 | £150,000 |
| 23 Oct 2000 | £64,000 |
9, School Lane, Bridlington YO15 1PB
| Today | See what it's worth now |
| 31 Mar 2026 | £198,000 |
| 17 Dec 2013 | £141,000 |
No other historical records.
2, Gull Nook, Bridlington YO15 1QJ
| Today | See what it's worth now |
| 31 Mar 2026 | £360,000 |
| 23 Jul 2009 | £170,000 |
New Cottage, High Street, Bridlington YO15 1JT
| Today | See what it's worth now |
| 31 Mar 2026 | £169,000 |
| 24 May 1996 | £38,500 |
No other historical records.
15, Ferndale Terrace, Bridlington YO15 3AU
| Today | See what it's worth now |
| 20 Mar 2026 | £160,000 |
| 11 Sep 2017 | £97,000 |
Green Acres, Bempton Lane, Bridlington YO15 1PS
| Today | See what it's worth now |
| 18 Mar 2026 | £340,000 |
| 28 Apr 2009 | £112,500 |
No other historical records.
1a The Old Bakery, Edgecliffe Villas, Bridlington YO15 2JL
| Today | See what it's worth now |
| 17 Mar 2026 | £274,000 |
| 11 Dec 2020 | £185,000 |
Flat 1, 47 49, Victoria Road, Bridlington YO15 2AT
| Today | See what it's worth now |
| 16 Mar 2026 | £66,000 |
| 27 May 2022 | £38,500 |
14, Georgian Way, Bridlington YO15 3TB
| Today | See what it's worth now |
| 12 Mar 2026 | £240,000 |
| 21 Sep 2012 | £139,000 |
44, Wellington Road, Bridlington YO15 2AZ
| Today | See what it's worth now |
| 9 Mar 2026 | £275,000 |
| 20 Oct 2017 | £159,950 |
2a, Eighth Avenue, Bridlington YO15 2LG
| Today | See what it's worth now |
| 9 Mar 2026 | £320,000 |
| 6 Jul 2018 | £249,950 |
3, Newcombe Croft, Bridlington YO15 1QQ
| Today | See what it's worth now |
| 27 Feb 2026 | £180,000 |
| 16 Nov 2018 | £143,600 |
No other historical records.
76, Mariners Court, West Street, Bridlington YO15 3DZ
| Today | See what it's worth now |
| 27 Feb 2026 | £168,500 |
| 30 May 2018 | £125,000 |
No other historical records.
49, Windsor Crescent, Bridlington YO15 3HZ
| Today | See what it's worth now |
| 27 Feb 2026 | £155,500 |
| 26 Jul 2018 | £127,500 |
35, Alexandra Court, Bridlington YO15 2LB
| Today | See what it's worth now |
| 26 Feb 2026 | £173,000 |
| 15 Jun 2006 | £165,000 |
Flat A, 26, Roundhay Road, Bridlington YO15 3JY
| Today | See what it's worth now |
| 24 Feb 2026 | £105,000 |
No other historical records.
Manor Farm Cottage, South Sea Road, Bridlington YO15 1AE
| Today | See what it's worth now |
| 12 Feb 2026 | £395,000 |
| 16 Jun 2017 | £240,000 |
170, Cardigan Road, Bridlington YO15 3NB
| Today | See what it's worth now |
| 11 Feb 2026 | £255,000 |
| 14 Dec 2020 | £175,000 |
No other historical records.
5, Meadowfield Road, Bridlington YO15 3LD
| Today | See what it's worth now |
| 9 Feb 2026 | £280,000 |
| 13 Dec 2022 | £323,000 |
Source Acknowledgement: © Crown copyright. England and Wales house price data is publicly available information produced by the HM Land Registry.This material was last updated on 9 July 2026. It covers the period from 1 January 1995 to 30 April 2026 and contains property transactions which have been registered during that period. Contains HM Land Registry data © Crown copyright and database right 2026. This data is licensed under the Open Government Licence v3.0.
Disclaimer: Rightmove.co.uk provides this HM Land Registry data "as is". The burden for fitness of the data relies completely with the user and is provided for informational purposes only. No warranty, express or implied, is given relating to the accuracy of content of the HM Land Registry data and Rightmove does not accept any liability for error or omission. If you have found an error with the data or need further information please contact HM Land Registry.
Permitted Use: Viewers of this Information are granted permission to access this Crown copyright material and to download it onto electronic, magnetic, optical or similar storage media provided that such activities are for private research, study or in-house use only. Any other use of the material requires the formal written permission of Land Registry which can be requested from us, and is subject to an additional licence and associated charge.
Rightmove takes no liability for your use of, or reliance on, Rightmove's Instant Valuation due to the limitations of our tracking tool listed here. Use of this tool is taken entirely at your own risk. All rights reserved.