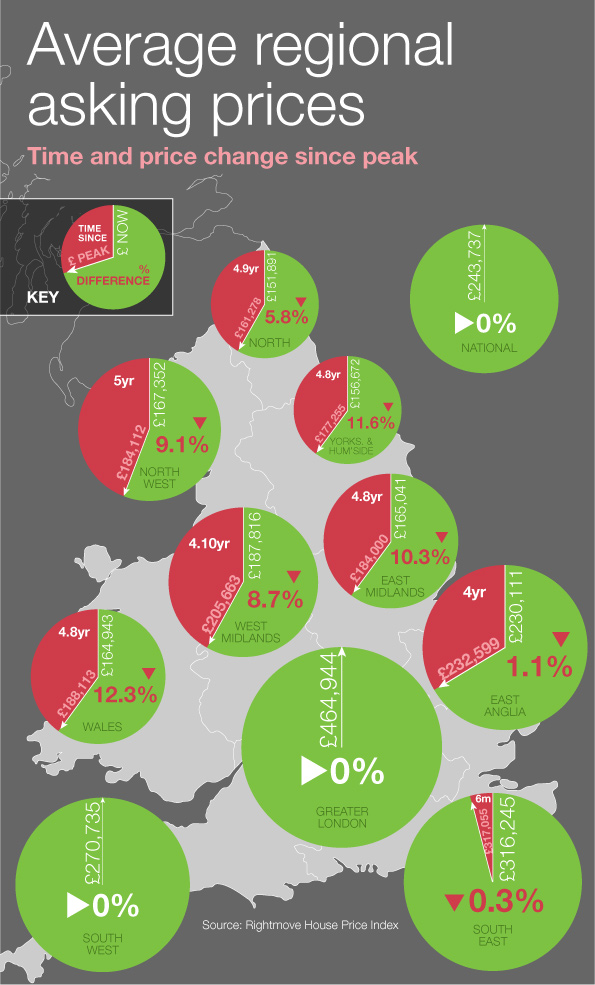
House Price Index April 2012 Infographic
Rightmove’s House Price Index for April 2012 is released today and reveals that the average asking price for a property in the UK is now at a new record, beating the previous peak set in May 2008. London and the South West also set new asking price records this month.
But how far are the other regions from their last peak price? Use our infographic to find out what’s happening in your part of the country…

Embed this infographic:
<a href=”http://rightmovenews.wpengine.com/news/articles/property-news/house-price-index-april-2012-infographic”><img title=”Rightmove House Price Index Infographic April 2012″ src=”https://www.rightmove.co.uk/news/content/uploads/2012/04/INFOGRAPHIC-April-HPI-regional-peaks-digital.jpg” alt=”Rightmove House Price Index Infographic April 2012″ width=”610″ border=”0″ /></a> [Source: <a href=’http://www.rightmove.co.uk’>Rightmove Property Portal</a>]


