July House Price Index Infographic
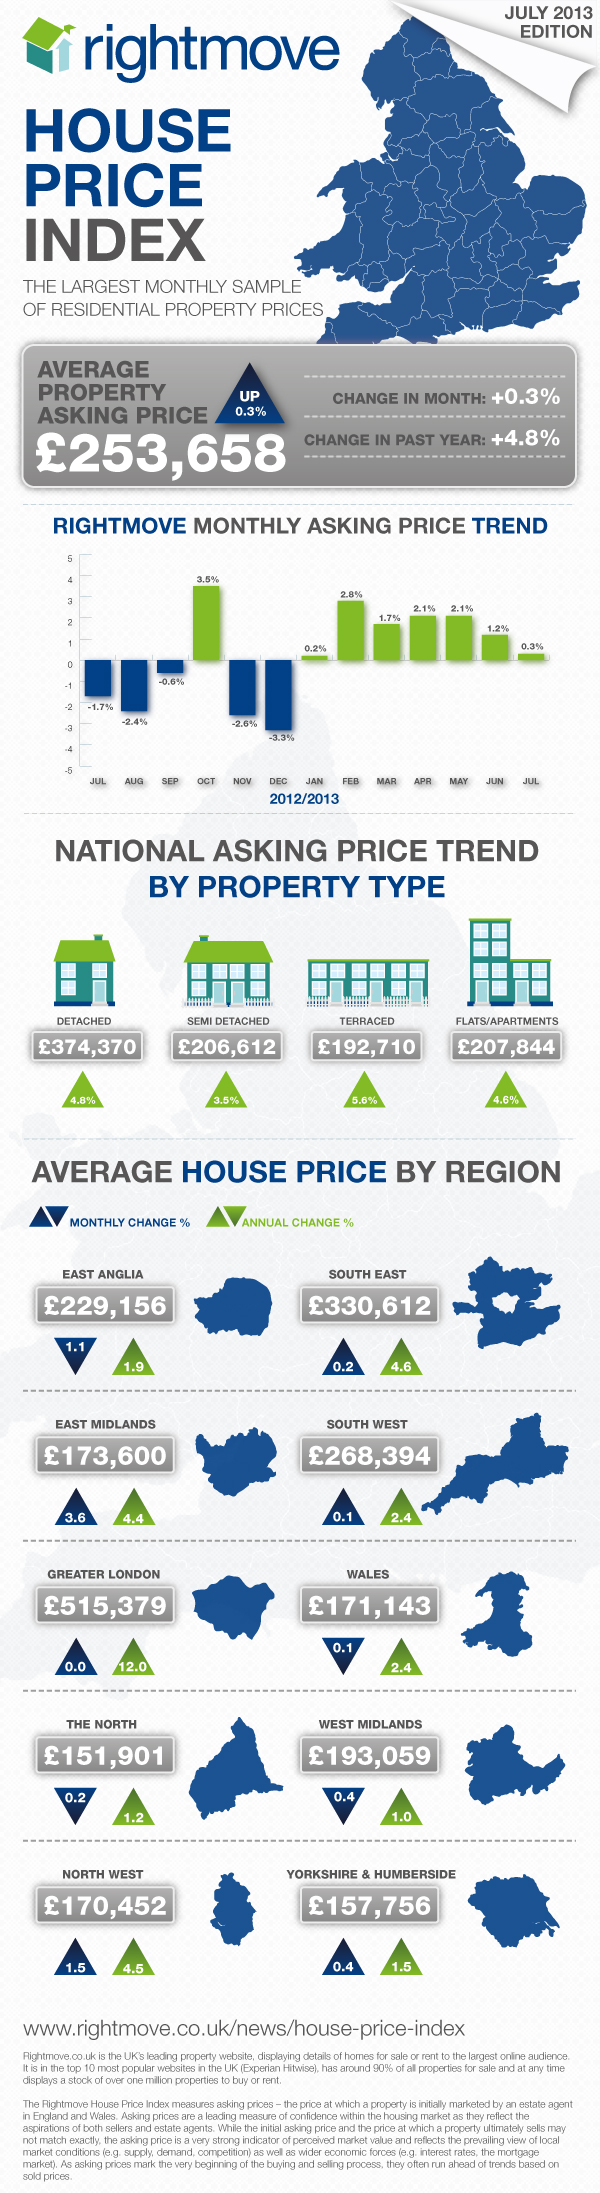
 Rightmove’s July House Price Index reported a seventh consecutive monthly rise in the price of property coming to market, up by 0.3% (+£860), and the second successive national record.
To view the full report click here or read the July House Price Index blog story here.
Our infographic provides a breakdown of how prices are performing across each region and property type.
To embed this infographic on your site, copy and paste the following code: