Largest ever drop in August asking prices as ‘Summer Sales’ kick in

The average asking price of newly-marketed property across England and Wales is down by 2.9% (-£7,758) this month compared to last. Whilst August is typically a quieter time of year with an average monthly price fall of 1.6% over the last 10 years, this is the largest decrease ever recorded by Rightmove at this time of year, and a lead indicator of a slower market in the second half of 2014. The price fall has been exacerbated by London recording a 5.9% drop, which is the largest of three consecutive monthly falls.
Miles Shipside, Rightmove director and housing market analyst comments:
“New seller asking prices are good lead indicators of the current mood of the market, and those who have put their property up for sale in the last month are obviously aware that potential buyers are thinner on the ground at this time of year and need to be tempted to act by cheaper prices. A drop in August is typical but it’s steeper than expected this year for two reasons. Firstly, both buyers and sellers are becoming increasingly aware about personal finances, given that the cost of mortgages are going up and regulators are trying to bring availability down. This limits what buyers are willing or able to pay, and helps moderate sellers price expectations. The second factor is the turnaround in London. Having forced national average prices up for the last two years, it’s now pushing them down with three falls in a row, and a real biggie this month. Holidays always cause a big price reverse in the capital, but there is also a massive year-on-year jump in the number of newly-marketed properties, up 20% compared to August last year, and double the figure seen in any other region. More sellers and fewer buyers mean price falls.”
So what do this month’s key property market statistics mean for buyers, sellers and the future outlook?
This month’s fall has caused a substantial drop in the annual rate of increase, though new seller asking prices are still 5.3% (+£13,202) higher than they were a year ago. This is down from 6.5% last month, and a sharp decline from the highest year-on-year rise of the year, which was 8.9% recorded just three months ago in May. Activity is traditionally strongest in the first half of the year, and this year seems to be following that pattern. A drop off in buyer demand and an 8% increase in property coming to market this month compared to August last year means more competition to sell, hence national average new seller asking prices have come down for the last two months.
Shipside advises:
“Those looking to buy should remember they are a scarcer species in the summer months, and if they can identify sellers who are keen to sell then there is a better deal to be had in many parts of the country. The big drop in new seller asking prices is evidence of a ‘Summer Sales’ mentality, with those coming to market at a quieter time of year obviously having a more pressing need to do so and pruning their prices. This is not a glut of property for sale or a major price drop drama, though we do expect more holiday season price falls next month before the usual autumn activity flurry. It will, however, come as some relief to the Bank of England that there are signs the market is effecting its own natural slowdown without a rate rise, though under-pinned by greater awareness among the public that the five year holiday of record low interest rates is coming to an end.”

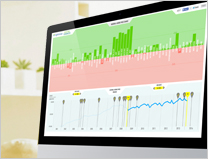
Rightmove has launched a House Price Trendometer for people to see how asking prices at a county level have fared since the House Price Index began back in 2001. Using the tool people can compare any two time periods between 2001 and 2014 and compare asking prices, while reading about the key milestones and events that have affected the housing market in England and Wales.


