- Key quarterly data
- Q2 2026 overview
- Leasing trends
- Investment trends
- About the Commercial Insights Tracker
Key quarterly data
Leasing
Investment
Q2 2026 overview
Office demand is down as businesses increasingly seek out higher quality workspace
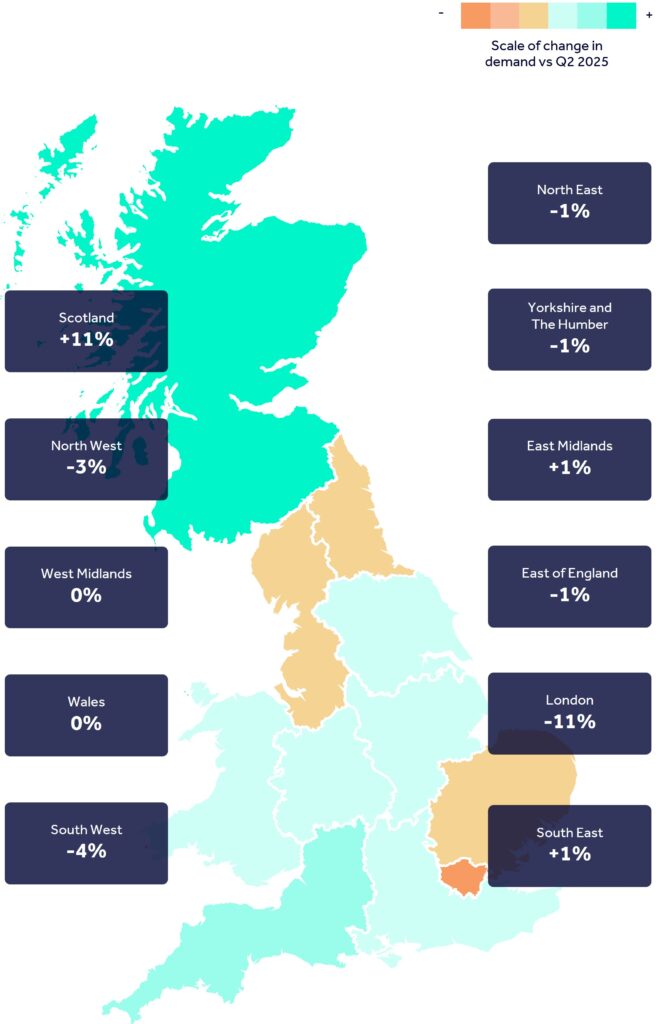
Leasing demand for offices in London dipped by 11% in the second quarter of 2026 compared to the same period last year, according to Rightmove’s latest Commercial Insights Tracker covering Q2.
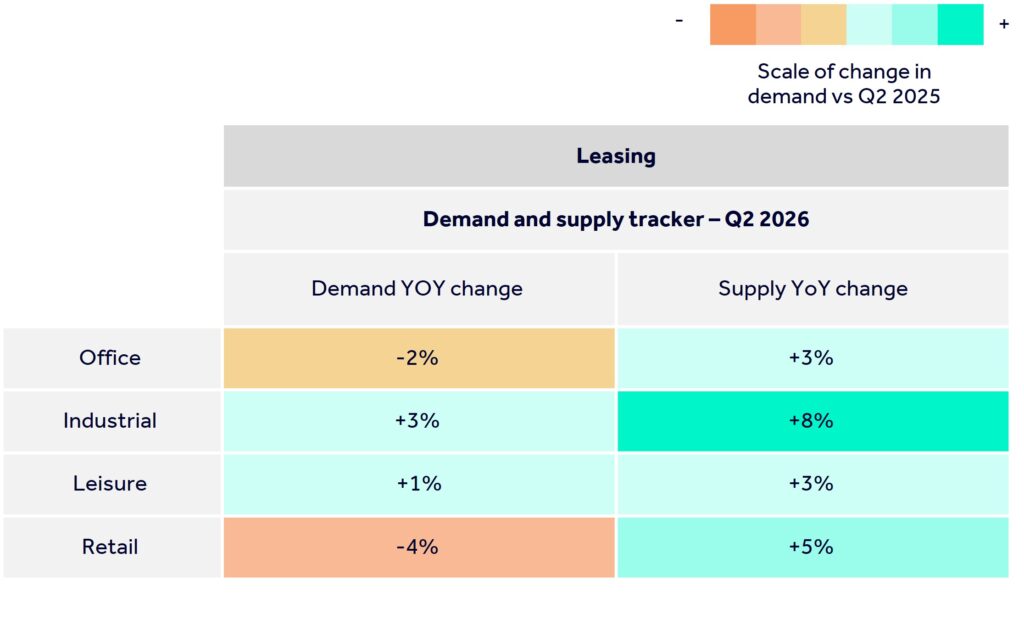
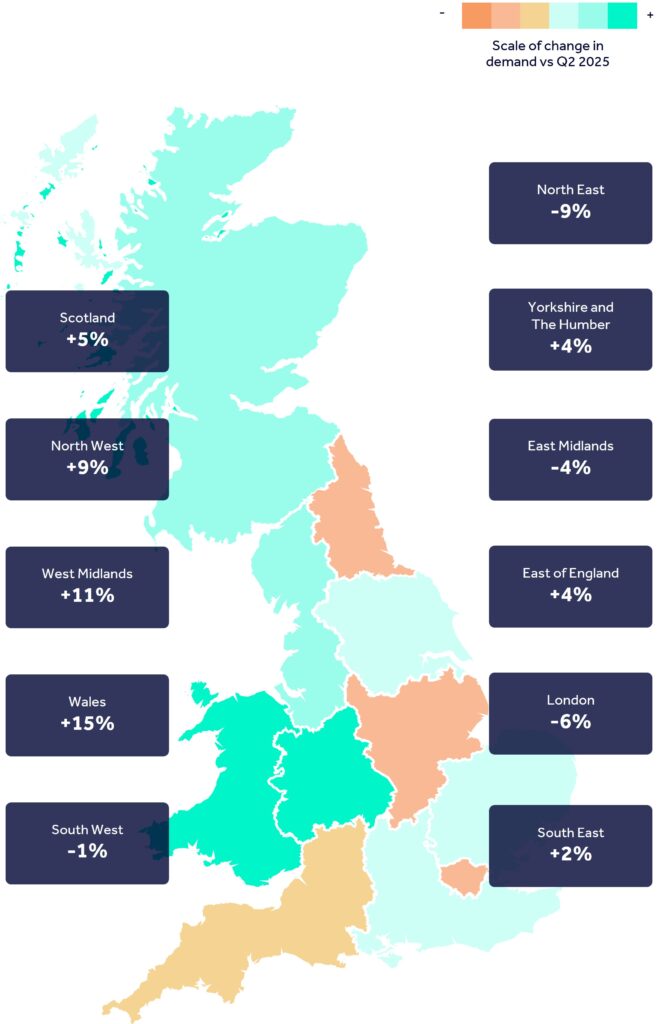
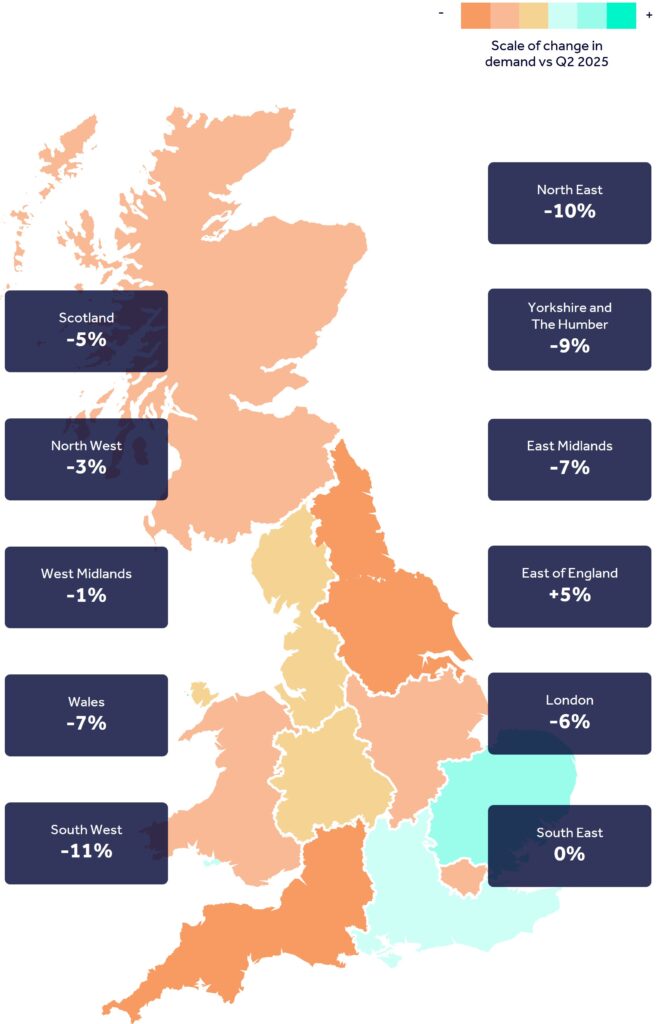
Nationally, demand to lease office space fell by 2%. Scotland (+11%), the East Midlands (+1%) and the South East (+1%) recorded growth in leasing demand for offices in Q2.
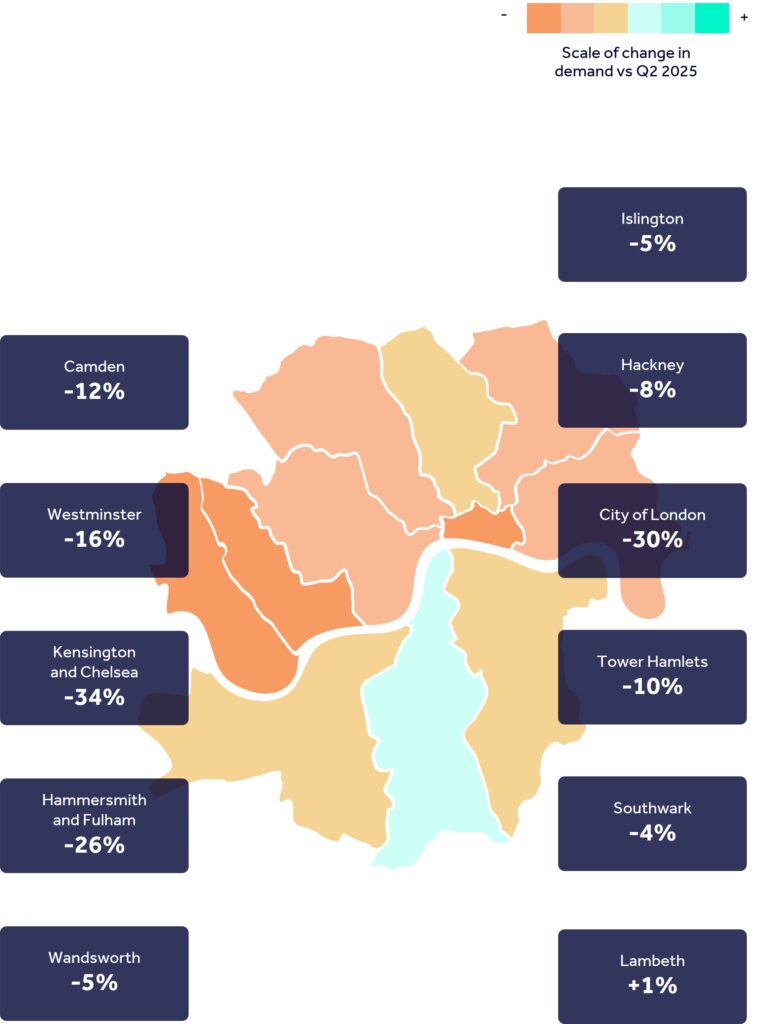
Indeed, office leasing demand is in negative territory across 10 of the 11 key London boroughs covered by Rightmove’s Commercial Insights Tracker. Lambeth (+1%) was the only area to record growth. The hardest hit borough was Kensington & Chelsea (-34%), followed by the City of London (-30%) and Hammersmith & Fulham (-26%).
However, experts suggest that the drop in demand for office space is more complex. While demand is increasingly waning for older, poorer quality office space, experts say demand is still extremely strong for more modern, energy efficient working space.
Louise Sedgwick, commercial director at Rightmove, said: “It has to be remembered that 2025 was a strong year for office demand on our platform, so this quarter’s annual drop is against a high base.
“Moreover, the headline statistics don’t tell the whole story. Demand in the London office market is becoming increasingly concentrated on the best-quality office space, with well-located Grade A buildings offering high levels of amenities and strong environmental credentials continuing to outperform.”
She added: “On the other hand, secondary office spaces, especially in less attractive locations are struggling. This isn’t just a London story – it’s something that we’re seeing in commercial centres across the country. Indeed, it’s also something that is being reported in major office markets in many European cities.”
Shabab Qadar, partner, London research, at Knight Frank, agrees. “Flight to quality is gathering pace – Q2 take-up reached 3.1m sq ft, up 24% quarter on quarter and 11% above the long-term average, with 70% of activity focused on new and refurbished offices,” he said.
“Momentum remains strong, with a further 3.7m sq ft under offer and active demand rising to 14.3m sq ft, up 43% year on year.”
In addition, Qadar said that demand is broadening, with King’s Cross/Euston recording 0.35m sq ft of take-up in Q2, “almost 200% above its long-term average, as AI-led occupiers reshape demand patterns across London”.
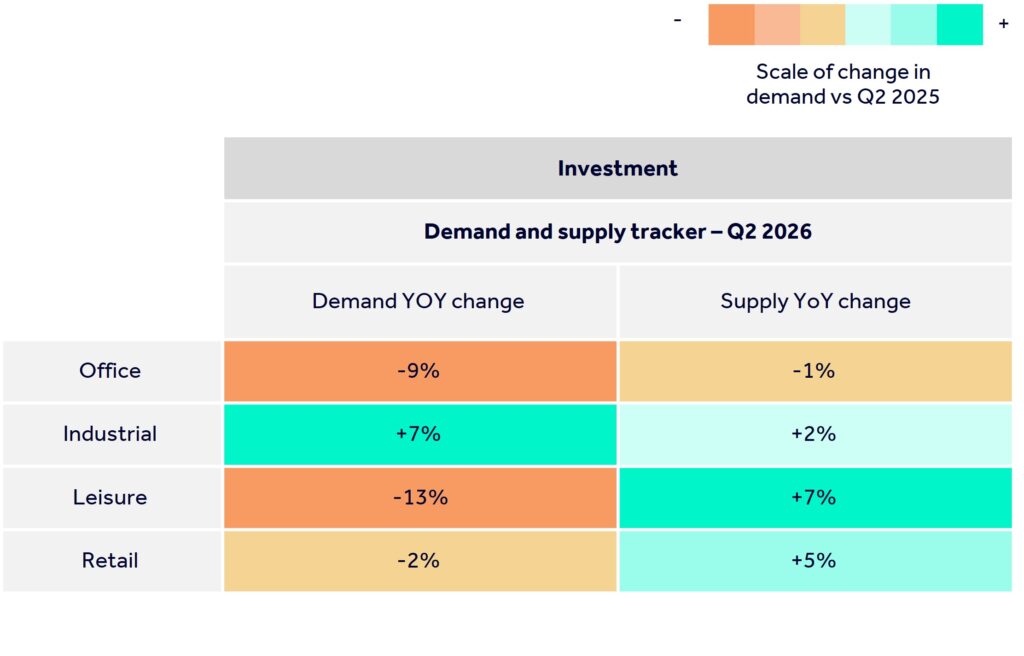
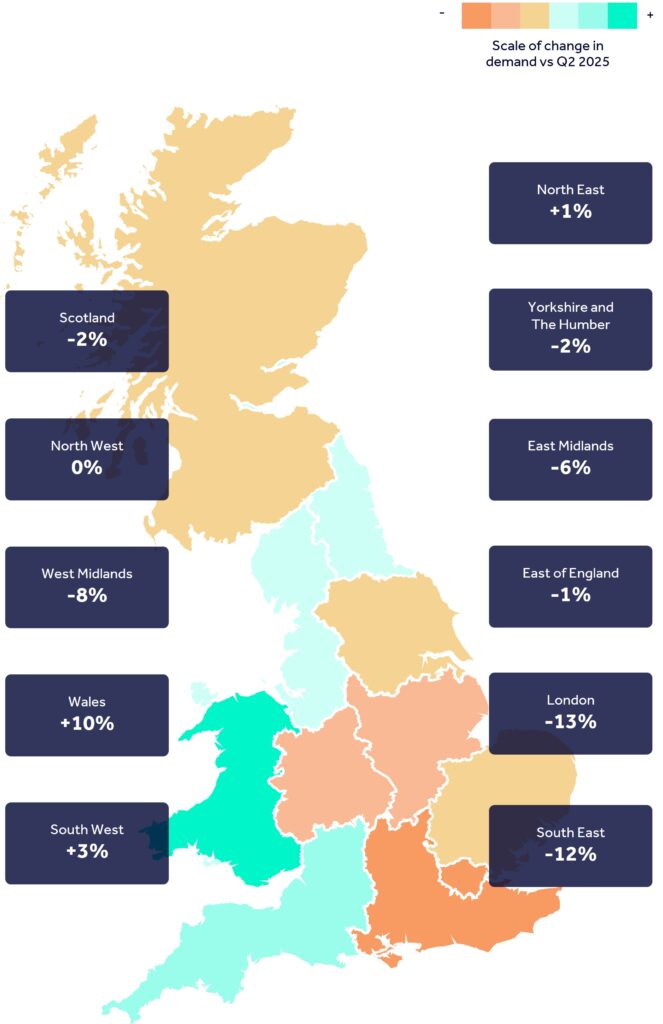
Investment demand for offices is also down at a national level (-9%), with London beating the average at -7%. Within London, however, investment performance varied between key markets.
“Liquidity remains subdued, but sentiment is turning,” said Qadar. “Investment volumes reached £2.0bn in Q2, still 30% below the long-term average, but conditions are improving. With £2.6bn under offer, £4.6bn of available opportunities and rising REIT share prices, investor conviction is strengthening.”
It should also be noted that the industrial and logistics sector continues to outperform the wider market, remaining the only sector showing growth across both leasing (+3%) and investment (+7%) demand, reinforcing its position as the most resilient commercial sector.
Leasing trends
Industrial demand
Leisure demand
Retail demand
Office demand
London office demand
Investment trends
Investment demand
About the Commercial Insights Tracker
•All data compares April 1st 2026 – June 30th 2026 with the same period a year ago
•Demand definition: Email enquiries to commercial agents about properties listed for lease, or investment via Rightmove
•Supply definition: The number of commercial property listings available for lease or investment on Rightmove, adjusted to remove the impact of growth in our customer base
•Sectors used to compile data: Office, Industrial, Leisure and Retail, unless otherwise stated as an overall market figure
•Colour key: Teal indicates areas where demand or available listing have increased year-on-year. Orange indicates areas where demand or available listings have decreased year-on-year
•We acknowledge that some market participants will look at demand and supply differently, for example as an aggregate of active searches by tenant representatives, measured in square feet. We aim to provide an alternative lens that makes the best use of our unique dataset
Copyright © 2000-2026 Rightmove Group Limited. All rights reserved. Rightmove prohibits the scraping of its content. You can find further details here.


