
House Prices in Ambergate
House prices in Ambergate have an overall average of £286,327 over the last year.
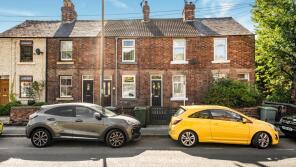
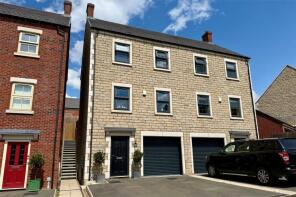
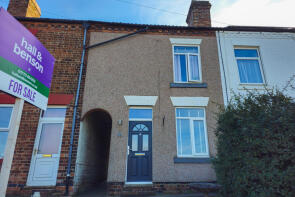
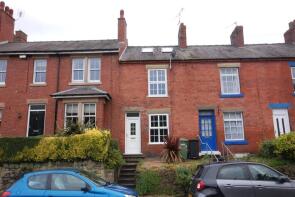
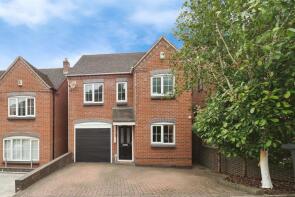
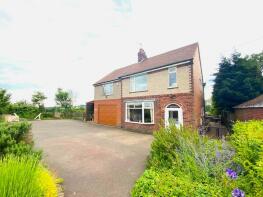
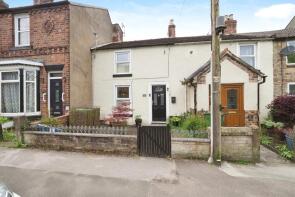
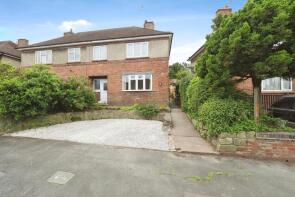
The majority of properties sold in Ambergate during the last year were detached properties, selling for an average price of £394,400. Semi-detached properties sold for an average of £258,167, with terraced properties fetching £168,143.
Overall, the historical sold prices in Ambergate over the last year were 3% down on the previous year and 13% down on the 2022 peak of £329,365.
Properties Sold
38, Derby Road, Ambergate, Belper DE56 2GE
| Today | See what it's worth now |
| 19 Dec 2025 | £175,000 |
| 13 Mar 2020 | £140,000 |
26, Stevenson Way, Ambergate, Belper DE56 2NF
| Today | See what it's worth now |
| 7 Nov 2025 | £290,000 |
| 15 Sep 2022 | £290,000 |
No other historical records.
74, Ripley Road, Sawmills, Belper DE56 2JQ
| Today | See what it's worth now |
| 6 Oct 2025 | £157,000 |
| 28 Jun 2021 | £140,000 |
19, Derby Road, Ambergate, Belper DE56 2GE
| Today | See what it's worth now |
| 5 Sep 2025 | £145,000 |
| 8 May 2019 | £115,000 |
100, Ripley Road, Sawmills, Belper DE56 2JQ
| Today | See what it's worth now |
| 4 Sep 2025 | £255,000 |
| 16 Aug 2019 | £187,500 |
4, Ripley Road, Sawmills, Belper DE56 2JQ
| Today | See what it's worth now |
| 28 Aug 2025 | £184,000 |
| 10 Aug 2016 | £125,000 |
No other historical records.
Coppins, Drovers Way, Ambergate, Belper DE56 2EZ
| Today | See what it's worth now |
| 28 Aug 2025 | £400,000 |
No other historical records.
Michaels Wood, Ridgeway Lane, Ridgeway, Belper DE56 2JT


| Today | See what it's worth now |
| 8 Aug 2025 | £375,000 |
No other historical records.
23, West Bank, Ambergate, Belper DE56 2GF
| Today | See what it's worth now |
| 1 Aug 2025 | £195,000 |
No other historical records.
35, Dungeley Hill, Heage, Belper DE56 2AN

| Today | See what it's worth now |
| 18 Jul 2025 | £495,000 |
No other historical records.
21, Villas Road, Ambergate, Belper DE56 2GQ
| Today | See what it's worth now |
| 25 Jun 2025 | £179,000 |
No other historical records.
1, Riversdale, Ambergate, Belper DE56 2EU
| Today | See what it's worth now |
| 13 Jun 2025 | £490,000 |
| 16 Dec 2005 | £264,000 |
No other historical records.
84, Ripley Road, Sawmills, Belper DE56 2JQ

| Today | See what it's worth now |
| 3 Jun 2025 | £150,000 |
| 5 Feb 2021 | £120,000 |
5, Tilling Close, Ambergate, Belper DE56 2ND
| Today | See what it's worth now |
| 30 May 2025 | £405,000 |
| 2 May 2025 | £250,000 |
37, Derby Road, Ambergate, Belper DE56 2GE
| Today | See what it's worth now |
| 30 May 2025 | £150,000 |
| 8 Oct 2015 | £108,500 |
24, Tilling Close, Ambergate, Belper DE56 2ND

| Today | See what it's worth now |
| 9 May 2025 | £470,000 |
No other historical records.
6, Bullbridge Hill, Ambergate, Belper DE56 2EW
| Today | See what it's worth now |
| 17 Apr 2025 | £200,000 |
| 21 Dec 2016 | £136,000 |
No other historical records.
15, Newbridge Road, Ambergate, Belper DE56 2GR
| Today | See what it's worth now |
| 28 Mar 2025 | £352,500 |
| 5 Oct 2017 | £260,000 |
41, Church Street, Heage, Belper DE56 2BG
| Today | See what it's worth now |
| 27 Mar 2025 | £337,000 |
No other historical records.
37, Shop Lane, Nether Heage, Belper DE56 2AR
| Today | See what it's worth now |
| 26 Mar 2025 | £225,000 |
No other historical records.
9, Moorlands Road, Ambergate, Belper DE56 2JB
| Today | See what it's worth now |
| 24 Mar 2025 | £272,000 |
| 25 Nov 2016 | £202,000 |
Sunningdale, Chesterfield Road, Heage, Belper DE56 2BH
| Today | See what it's worth now |
| 21 Mar 2025 | £570,000 |
| 2 Jan 1997 | £132,000 |
No other historical records.
50, Derby Road, Ambergate, Belper DE56 2GE
| Today | See what it's worth now |
| 18 Mar 2025 | £205,000 |
| 14 Dec 2018 | £155,000 |
No other historical records.
Plots 4, Bullbridge Hill, Ambergate, Belper DE56 2NN

| Today | See what it's worth now |
| 7 Mar 2025 | £310,000 |
| 23 Mar 2024 | £240,000 |
No other historical records.
14, Bentfield Road, Nether Heage, Belper DE56 2AX
| Today | See what it's worth now |
| 7 Mar 2025 | £208,000 |
| 30 Jul 1999 | £45,950 |
No other historical records.
Source Acknowledgement: © Crown copyright. England and Wales house price data is publicly available information produced by the HM Land Registry.This material was last updated on 4 February 2026. It covers the period from 1 January 1995 to 24 December 2025 and contains property transactions which have been registered during that period. Contains HM Land Registry data © Crown copyright and database right 2026. This data is licensed under the Open Government Licence v3.0.
Disclaimer: Rightmove.co.uk provides this HM Land Registry data "as is". The burden for fitness of the data relies completely with the user and is provided for informational purposes only. No warranty, express or implied, is given relating to the accuracy of content of the HM Land Registry data and Rightmove does not accept any liability for error or omission. If you have found an error with the data or need further information please contact HM Land Registry.
Permitted Use: Viewers of this Information are granted permission to access this Crown copyright material and to download it onto electronic, magnetic, optical or similar storage media provided that such activities are for private research, study or in-house use only. Any other use of the material requires the formal written permission of Land Registry which can be requested from us, and is subject to an additional licence and associated charge.
Map data ©OpenStreetMap contributors.
Rightmove takes no liability for your use of, or reliance on, Rightmove's Instant Valuation due to the limitations of our tracking tool listed here. Use of this tool is taken entirely at your own risk. All rights reserved.