
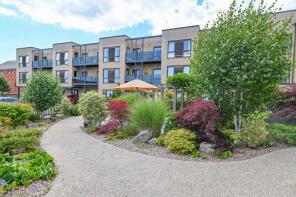
House Prices in Anmore
House prices in Anmore have an overall average of £398,581 over the last year.
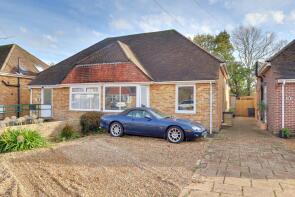
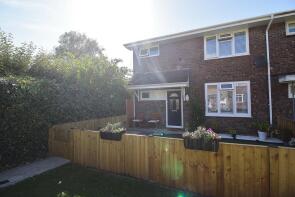
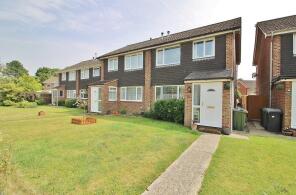
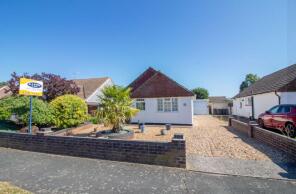
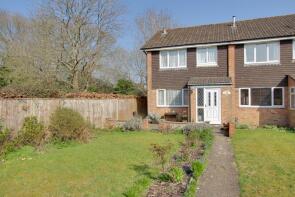
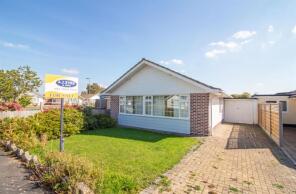
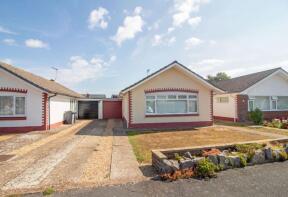
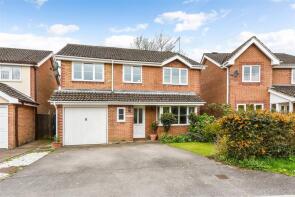
The majority of properties sold in Anmore during the last year were detached properties, selling for an average price of £494,706. Semi-detached properties sold for an average of £370,267, with terraced properties fetching £315,829.
Overall, the historical sold prices in Anmore over the last year were 5% up on the previous year and similar to the 2023 peak of £395,641.
Properties Sold
20, Mill Road, Waterlooville PO7 6PA
| Today | See what it's worth now |
| 24 Apr 2026 | £425,000 |
| 23 Feb 2010 | £237,500 |
9, Hatchmore Road, Waterlooville PO7 6TE
| Today | See what it's worth now |
| 10 Apr 2026 | £532,000 |
| 17 Mar 2004 | £335,000 |
No other historical records.
136, Sunnymead Drive, Waterlooville PO7 6BU
| Today | See what it's worth now |
| 27 Mar 2026 | £295,500 |
| 27 Mar 2000 | £101,500 |
No other historical records.
1, Armstrong Close, Waterlooville PO7 6AY
| Today | See what it's worth now |
| 26 Mar 2026 | £475,000 |
| 26 Sep 2022 | £445,000 |
No other historical records.
30, Martin Avenue, Waterlooville PO7 6NS
| Today | See what it's worth now |
| 25 Mar 2026 | £370,000 |
| 31 Jul 2018 | £253,000 |
No other historical records.
19, Brookside Close, Waterlooville PO7 6ET
| Today | See what it's worth now |
| 12 Mar 2026 | £305,000 |
| 31 Mar 2000 | £88,000 |
No other historical records.
35, Yew Tree Gardens, Waterlooville PO7 6LH
| Today | See what it's worth now |
| 11 Mar 2026 | £318,500 |
| 15 Feb 2023 | £315,000 |
Brow View, Closewood Road, Waterlooville PO7 6JD

| Today | See what it's worth now |
| 4 Mar 2026 | £485,000 |
| 30 May 2014 | £335,000 |
79, Haslar Crescent, Waterlooville PO7 6DD
| Today | See what it's worth now |
| 27 Feb 2026 | £330,000 |
| 27 Mar 1997 | £75,000 |
No other historical records.
36, Copper Beeches, Home Mead, Waterlooville PO7 6YQ

| Today | See what it's worth now |
| 27 Feb 2026 | £144,500 |
| 7 Dec 2009 | £135,000 |
No other historical records.
20, Yew Tree Gardens, Waterlooville PO7 6LH
| Today | See what it's worth now |
| 27 Feb 2026 | £279,500 |
| 27 Aug 2010 | £181,000 |
34, Lucerne Avenue, Waterlooville PO7 6BB
| Today | See what it's worth now |
| 20 Feb 2026 | £349,250 |
| 6 Mar 1998 | £94,000 |
No other historical records.
30, Windsor Road, Waterlooville PO7 6BA
| Today | See what it's worth now |
| 13 Feb 2026 | £342,500 |
No other historical records.
13, Peakfield, Waterlooville PO7 6YP
| Today | See what it's worth now |
| 12 Feb 2026 | £505,000 |
| 14 Nov 2003 | £263,000 |
151, Silverdale Drive, Waterlooville PO7 6DX

| Today | See what it's worth now |
| 9 Feb 2026 | £300,000 |
| 13 Jan 2017 | £228,000 |
No other historical records.
5, Wellesley Court, Darnel Road, Waterlooville PO7 7YP
| Today | See what it's worth now |
| 5 Feb 2026 | £172,000 |
| 18 Feb 2020 | £222,650 |
No other historical records.
8, Brookside Close, Waterlooville PO7 6ET
| Today | See what it's worth now |
| 2 Feb 2026 | £300,000 |
| 25 Aug 2023 | £270,000 |
Flat 5, Mouliere Court, St Georges Road, Waterlooville PO7 6FW
| Today | See what it's worth now |
| 2 Feb 2026 | £227,500 |
| 10 May 2019 | £193,000 |
No other historical records.
Flat D, 4, The Spinney, Waterlooville PO7 6FZ
| Today | See what it's worth now |
| 30 Jan 2026 | £175,000 |
| 9 Oct 2015 | £170,000 |
No other historical records.
21, Yew Tree Gardens, Waterlooville PO7 6LH
| Today | See what it's worth now |
| 21 Jan 2026 | £310,000 |
| 16 Mar 2021 | £257,000 |
34, Three Acres, Waterlooville PO7 6QD
| Today | See what it's worth now |
| 21 Jan 2026 | £440,000 |
| 4 Mar 2022 | £422,000 |
35, The Meadow, Waterlooville PO7 6YJ
| Today | See what it's worth now |
| 15 Jan 2026 | £350,000 |
| 16 Feb 2001 | £129,950 |
66, Bere Road, Waterlooville PO7 6PH
| Today | See what it's worth now |
| 13 Jan 2026 | £335,000 |
| 30 Jan 1998 | £75,000 |
No other historical records.
Source Acknowledgement: © Crown copyright. England and Wales house price data is publicly available information produced by the HM Land Registry.This material was last updated on 9 July 2026. It covers the period from 1 January 1995 to 30 April 2026 and contains property transactions which have been registered during that period. Contains HM Land Registry data © Crown copyright and database right 2026. This data is licensed under the Open Government Licence v3.0.
Disclaimer: Rightmove.co.uk provides this HM Land Registry data "as is". The burden for fitness of the data relies completely with the user and is provided for informational purposes only. No warranty, express or implied, is given relating to the accuracy of content of the HM Land Registry data and Rightmove does not accept any liability for error or omission. If you have found an error with the data or need further information please contact HM Land Registry.
Permitted Use: Viewers of this Information are granted permission to access this Crown copyright material and to download it onto electronic, magnetic, optical or similar storage media provided that such activities are for private research, study or in-house use only. Any other use of the material requires the formal written permission of Land Registry which can be requested from us, and is subject to an additional licence and associated charge.
Rightmove takes no liability for your use of, or reliance on, Rightmove's Instant Valuation due to the limitations of our tracking tool listed here. Use of this tool is taken entirely at your own risk. All rights reserved.