
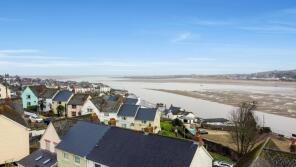
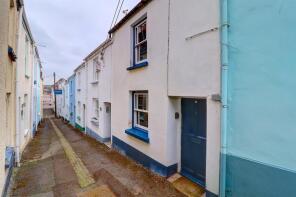
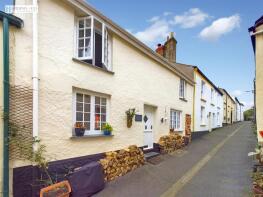
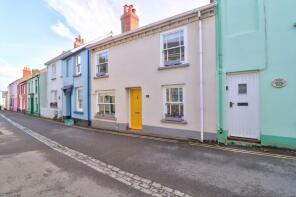
House Prices in Appledore
House prices in Appledore have an overall average of £357,905 over the last year.
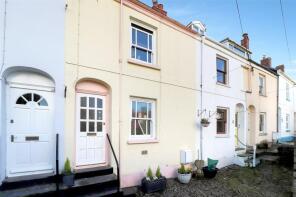
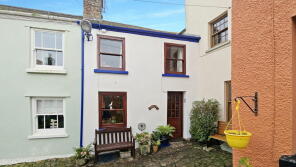
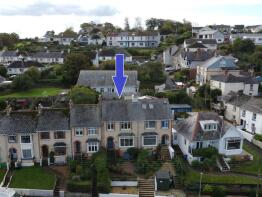
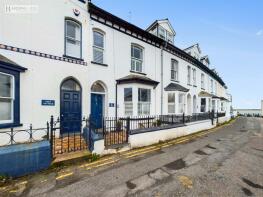
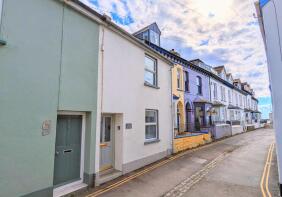
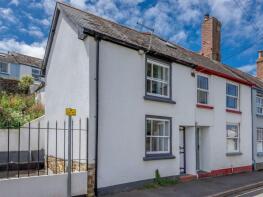
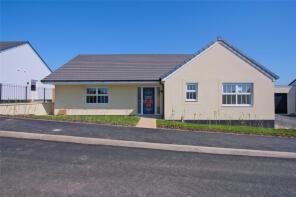
The majority of properties sold in Appledore during the last year were terraced properties, selling for an average price of £353,367. Semi-detached properties sold for an average of £334,333, with detached properties fetching £497,498.
Overall, the historical sold prices in Appledore over the last year were 10% down on the previous year and 15% down on the 2023 peak of £421,779.
Properties Sold
17, South Road, Bideford EX39 1QH
| Today | See what it's worth now |
| 7 Nov 2025 | £345,000 |
| 10 Mar 2016 | £220,000 |
36, New Street, Bideford EX39 1QJ
| Today | See what it's worth now |
| 4 Nov 2025 | £287,500 |
| 28 Oct 2016 | £190,000 |
29, Bude Street, Appledore EX39 1PS
| Today | See what it's worth now |
| 10 Oct 2025 | £530,000 |
No other historical records.
5, New Street, Appledore EX39 1QJ
| Today | See what it's worth now |
| 11 Aug 2025 | £220,000 |
No other historical records.
88, Irsha Street, Bideford EX39 1RY

| Today | See what it's worth now |
| 17 Jul 2025 | £310,000 |
| 12 Dec 2018 | £270,000 |
3, Harbour Lights, Torridge Road, Bideford EX39 1SF
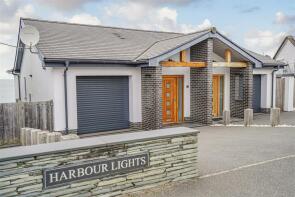
| Today | See what it's worth now |
| 4 Jul 2025 | £695,000 |
| 27 Jan 2017 | £525,000 |
No other historical records.
41, Bude Street, Appledore EX39 1PS
| Today | See what it's worth now |
| 1 Jul 2025 | £449,000 |
| 30 Nov 2011 | £187,500 |
Watersmeet, Churchill Way, Bideford EX39 1PA
| Today | See what it's worth now |
| 30 Jun 2025 | £610,000 |
| 16 Jul 1997 | £133,500 |
No other historical records.
5, River View, Bideford EX39 1GA
| Today | See what it's worth now |
| 24 Jun 2025 | £274,000 |
| 17 Aug 2023 | £299,995 |
No other historical records.
10, Vernons Lane, Appledore EX39 1QU
| Today | See what it's worth now |
| 20 Jun 2025 | £225,000 |
No other historical records.
Flat 4, 7, Bude Street, Appledore EX39 1PS


| Today | See what it's worth now |
| 13 Jun 2025 | £217,500 |
| 18 Aug 2000 | £75,000 |
No other historical records.
3, Darracotts Court, Appledore EX39 1RT
| Today | See what it's worth now |
| 2 May 2025 | £288,000 |
No other historical records.
Beulah, Tomouth Road, Bideford EX39 1QD
| Today | See what it's worth now |
| 31 Mar 2025 | £345,000 |
| 20 Nov 2023 | £330,000 |
8, Hillcliff Terrace, Irsha Street, Bideford EX39 1SA
| Today | See what it's worth now |
| 28 Mar 2025 | £405,000 |
| 4 Jul 2016 | £310,000 |
35, Market Street, Bideford EX39 1PP

| Today | See what it's worth now |
| 28 Mar 2025 | £375,000 |
| 15 Nov 2019 | £250,000 |
7, One End Street, Bideford EX39 1PN
| Today | See what it's worth now |
| 28 Mar 2025 | £402,500 |
| 3 Aug 2022 | £420,000 |
38, Irsha Street, Bideford EX39 1RZ
| Today | See what it's worth now |
| 28 Mar 2025 | £310,000 |
| 28 Mar 2018 | £250,000 |
4, Pen Stour Lane, Appledore EX39 1GH

| Today | See what it's worth now |
| 21 Mar 2025 | £384,995 |
No other historical records.
3 Spindleberry Cottage, Myrtle Street, Bideford EX39 1PH
| Today | See what it's worth now |
| 10 Mar 2025 | £280,000 |
| 15 Aug 2019 | £180,000 |
22, One End Street, Bideford EX39 1PN
| Today | See what it's worth now |
| 7 Mar 2025 | £275,000 |
| 6 Jun 2016 | £176,000 |
10, Irsha Street, Bideford EX39 1RZ
| Today | See what it's worth now |
| 7 Mar 2025 | £287,500 |
| 10 Feb 2017 | £190,000 |
No other historical records.
7, Pen Stour Lane, Appledore EX39 1GH

| Today | See what it's worth now |
| 21 Feb 2025 | £489,995 |
No other historical records.
9, New Quay Street, Bideford EX39 1LU
| Today | See what it's worth now |
| 14 Feb 2025 | £265,000 |
| 15 Jun 2018 | £182,000 |
15, Pen Stour Lane, Appledore EX39 1GH
| Today | See what it's worth now |
| 14 Feb 2025 | £379,995 |
No other historical records.
8, Pen Stour Lane, Appledore EX39 1GH

| Today | See what it's worth now |
| 31 Jan 2025 | £484,995 |
No other historical records.
Source Acknowledgement: © Crown copyright. England and Wales house price data is publicly available information produced by the HM Land Registry.This material was last updated on 4 February 2026. It covers the period from 1 January 1995 to 24 December 2025 and contains property transactions which have been registered during that period. Contains HM Land Registry data © Crown copyright and database right 2026. This data is licensed under the Open Government Licence v3.0.
Disclaimer: Rightmove.co.uk provides this HM Land Registry data "as is". The burden for fitness of the data relies completely with the user and is provided for informational purposes only. No warranty, express or implied, is given relating to the accuracy of content of the HM Land Registry data and Rightmove does not accept any liability for error or omission. If you have found an error with the data or need further information please contact HM Land Registry.
Permitted Use: Viewers of this Information are granted permission to access this Crown copyright material and to download it onto electronic, magnetic, optical or similar storage media provided that such activities are for private research, study or in-house use only. Any other use of the material requires the formal written permission of Land Registry which can be requested from us, and is subject to an additional licence and associated charge.
Map data ©OpenStreetMap contributors.
Rightmove takes no liability for your use of, or reliance on, Rightmove's Instant Valuation due to the limitations of our tracking tool listed here. Use of this tool is taken entirely at your own risk. All rights reserved.