
House Prices in Ashford
House prices in Ashford have an overall average of £444,883 over the last year.
The majority of properties sold in Ashford during the last year were semi-detached properties, selling for an average price of £518,632. Flats sold for an average of £274,382, with terraced properties fetching £446,038.
Overall, the historical sold prices in Ashford over the last year were 2% down on the previous year and 4% up on the 2023 peak of £428,739.
Properties Sold
2, Perrin Court, Parkland Grove, Ashford TW15 2GA

| Today | See today's value |
| 21 Aug 2026 | £146,500 |
| 11 Mar 2022 | £219,950 |
8, Wellington Court, Ashford TW15 3RR
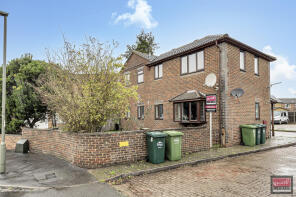
| Today | See today's value |
| 17 Aug 2026 | £290,000 |
| 10 Nov 2017 | £270,000 |
28, Stanwell Road, Ashford TW15 3ER
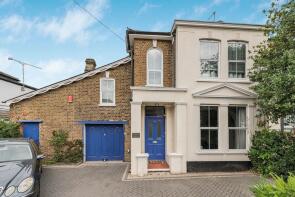
| Today | See today's value |
| 14 Aug 2026 | £640,000 |
| 2 May 2017 | £555,000 |
No other historical records.
32 Sans Souci, Glenfield Road, Ashford TW15 1JL
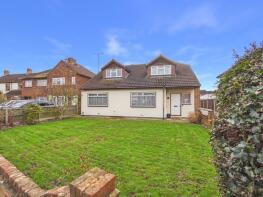
| Today | See today's value |
| 13 Aug 2026 | £580,000 |
| 27 Mar 2006 | £345,000 |
No other historical records.
6, Eaton House, Chertsey Road, Ashford TW15 1SF
| Today | See today's value |
| 11 Aug 2026 | £292,500 |
| 29 Mar 2019 | £280,000 |
No other historical records.
14, Mercia House, Ashford Road, Ashford TW15 1PA
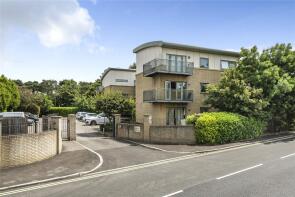
| Today | See today's value |
| 11 Aug 2026 | £260,000 |
| 16 Apr 2014 | £231,500 |
42, Reedsfield Road, Ashford TW15 2HE
| Today | See today's value |
| 11 Aug 2026 | £450,000 |
No other historical records.
24, Fairview Court, Manor Road, Ashford TW15 2SN
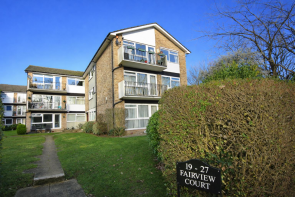
| Today | See today's value |
| 10 Aug 2026 | £315,000 |
| 20 Aug 2010 | £210,000 |
No other historical records.
29, Parkland Grove, Ashford TW15 2JB
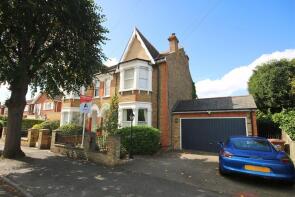
| Today | See today's value |
| 6 Aug 2026 | £815,000 |
No other historical records.
29, Tasman Court, Staines Road West, Sunbury-on-thames TW16 7BA
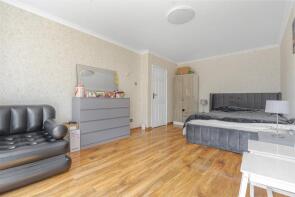
| Today | See today's value |
| 6 Aug 2026 | £240,000 |
| 7 Sep 2015 | £246,500 |
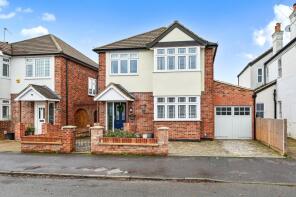
14, Wellington Road, Ashford TW15 3RJ
| Today | See today's value |
| 6 Aug 2026 | £650,000 |
| 7 Feb 2014 | £395,000 |
No other historical records.
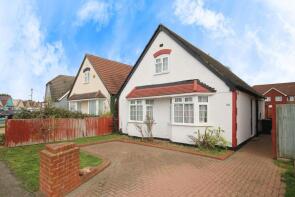
33, Wrens Avenue, Ashford TW15 1AP
| Today | See today's value |
| 5 Aug 2026 | £462,000 |
| 17 Mar 2006 | £220,000 |
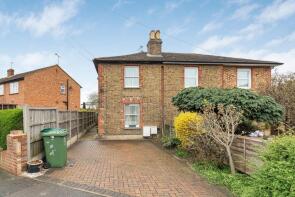
50, Napier Road, Ashford TW15 1TG
| Today | See today's value |
| 3 Aug 2026 | £425,000 |
| 20 Mar 2015 | £280,000 |
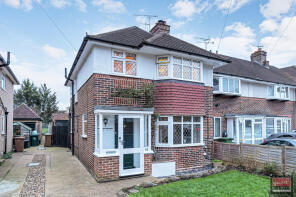
15, Tudor Close, Ashford TW15 3HZ
| Today | See today's value |
| 3 Aug 2026 | £500,000 |
| 31 Jul 2014 | £330,000 |
No other historical records.
6, Rosary Gardens, Ashford TW15 1BX
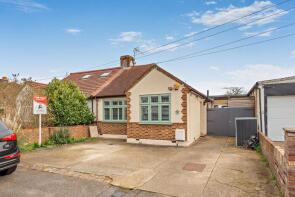
| Today | See today's value |
| 31 Jul 2026 | £515,000 |
| 24 Mar 2017 | £420,000 |
34, Selby Road, Ashford TW15 1JH
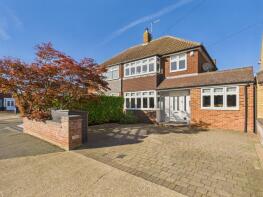
| Today | See today's value |
| 30 Jul 2026 | £675,000 |
| 31 Jul 2002 | £239,950 |
No other historical records.
25, Feltham Road, Ashford TW15 1DQ
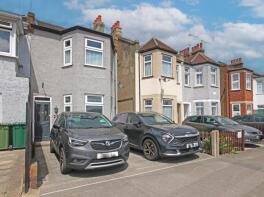
| Today | See today's value |
| 30 Jul 2026 | £415,000 |
| 18 Sep 2020 | £362,500 |
96, Alexandra Road, Ashford TW15 1SZ
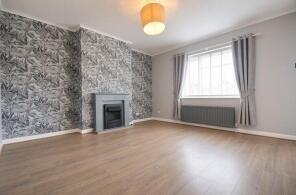
| Today | See today's value |
| 23 Jul 2026 | £450,000 |
| 26 Feb 2016 | £314,950 |
No other historical records.
28, Cumberland Road, Ashford TW15 3BX
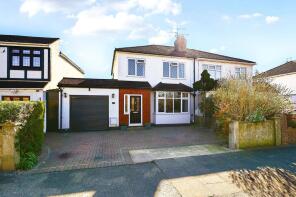
| Today | See today's value |
| 22 Jul 2026 | £575,000 |
| 4 Apr 1997 | £119,995 |
No other historical records.
22, Cambridge Road, Ashford TW15 1UF
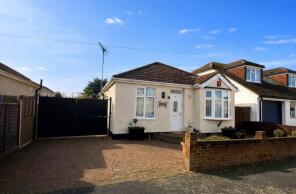
| Today | See today's value |
| 17 Jul 2026 | £475,000 |
| 22 Oct 2009 | £248,000 |
8, Limes Close, Ashford TW15 2NL
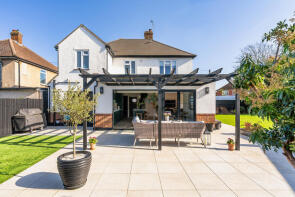
| Today | See today's value |
| 16 Jul 2026 | £930,000 |
| 10 Nov 2017 | £525,000 |
No other historical records.
30, Fordbridge Road, Ashford TW15 2SG
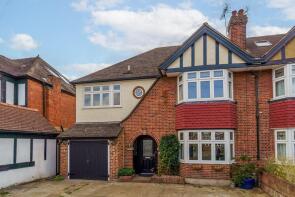
| Today | See today's value |
| 10 Jul 2026 | £750,000 |
| 12 Jul 2001 | £249,950 |
No other historical records.
14, Sundown Road, Ashford TW15 1EW

| Today | See today's value |
| 10 Jul 2026 | £508,000 |
| 23 Jan 2003 | £228,000 |

Rightmove takes no liability for your use of, or reliance on, Rightmove's Instant Valuation due to the limitations of our tracking tool listed here. Use of this tool is taken entirely at your own risk. All rights reserved.