
House Prices in B1 2BQ
House prices in B1 2BQ have an overall average of £158,650 over the last year.
Overall, the historical sold prices in B1 2BQ over the last year were 54% down on the previous year and 50% down on the 2023 peak of £317,700.
Properties Sold
Apartment 1, Lockside House, Scotland Street, Birmingham B1 2BQ
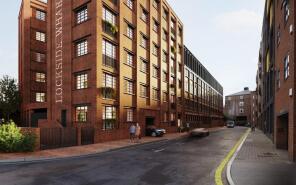
| Today | See what it's worth now |
| 24 Jun 2025 | £150,000 |
No other historical records.
3, Scotland Street, Birmingham B1 2BQ

| Today | See what it's worth now |
| 20 Jun 2025 | £167,300 |
No other historical records.
Apartment 20, Lockside House, Scotland Street, Birmingham B1 2BQ
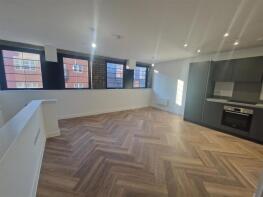
| Today | See what it's worth now |
| 25 Nov 2024 | £324,950 |
No other historical records.
Apartment 18, Lockside House, Scotland Street, Birmingham B1 2BQ
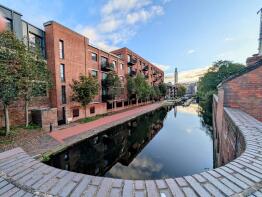
| Today | See what it's worth now |
| 24 Sep 2024 | £299,950 |
No other historical records.
Apartment 33, Lockside House, Scotland Street, Birmingham B1 2BQ

| Today | See what it's worth now |
| 20 Sep 2024 | £377,950 |
No other historical records.
Apartment 25, Lockside House, Scotland Street, Birmingham B1 2BQ

| Today | See what it's worth now |
| 20 Sep 2024 | £374,950 |
No other historical records.
Apartment 41, Lockside House, Scotland Street, Birmingham B1 2BQ

| Today | See what it's worth now |
| 20 Sep 2024 | £444,950 |
No other historical records.
Apartment 43, Lockside House, Scotland Street, Birmingham B1 2BQ

| Today | See what it's worth now |
| 20 Sep 2024 | £384,950 |
No other historical records.
Apartment 10, Lockside House, Scotland Street, Birmingham B1 2BQ
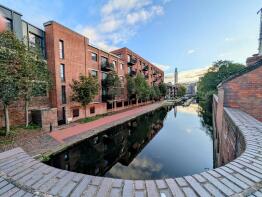
| Today | See what it's worth now |
| 19 Sep 2024 | £299,950 |
No other historical records.
Apartment 35, Lockside House, Scotland Street, Birmingham B1 2BQ
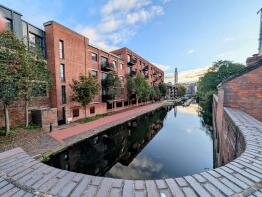
| Today | See what it's worth now |
| 16 Sep 2024 | £304,950 |
No other historical records.
Apartment 34, Lockside House, Scotland Street, Birmingham B1 2BQ
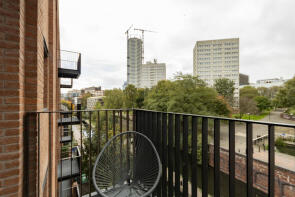
| Today | See what it's worth now |
| 16 Sep 2024 | £364,950 |
No other historical records.
Apartment 30, Lockside House, Scotland Street, Birmingham B1 2BQ
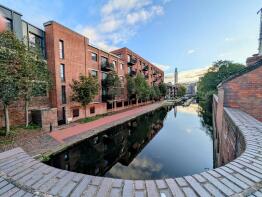
| Today | See what it's worth now |
| 16 Sep 2024 | £339,950 |
No other historical records.
Apartment 9, Lockside House, Scotland Street, Birmingham B1 2BQ

| Today | See what it's worth now |
| 16 Sep 2024 | £349,950 |
No other historical records.
Apartment 27, Lockside House, Scotland Street, Birmingham B1 2BQ
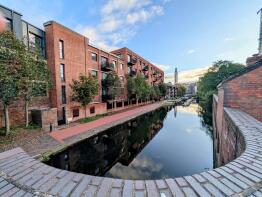
| Today | See what it's worth now |
| 12 Sep 2024 | £299,950 |
No other historical records.
Apartment 37, Lockside House, Scotland Street, Birmingham B1 2BQ

| Today | See what it's worth now |
| 11 Sep 2024 | £304,950 |
No other historical records.
Apartment 26, Lockside House, Scotland Street, Birmingham B1 2BQ
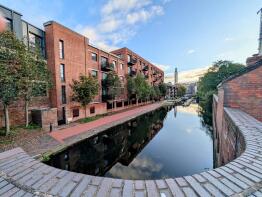
| Today | See what it's worth now |
| 11 Sep 2024 | £364,950 |
No other historical records.
Apartment 32, Lockside House, Scotland Street, Birmingham B1 2BQ

| Today | See what it's worth now |
| 10 Sep 2024 | £464,950 |
No other historical records.
Apartment 49, Lockside House, Scotland Street, Birmingham B1 2BQ

| Today | See what it's worth now |
| 4 Jan 2024 | £299,950 |
No other historical records.
Apartment 56, Lockside House, Scotland Street, Birmingham B1 2BQ

| Today | See what it's worth now |
| 18 Dec 2023 | £289,950 |
No other historical records.
Apartment 58, Lockside House, Scotland Street, Birmingham B1 2BQ

| Today | See what it's worth now |
| 27 Nov 2023 | £359,950 |
No other historical records.
Apartment 54, Lockside House, Scotland Street, Birmingham B1 2BQ

| Today | See what it's worth now |
| 27 Nov 2023 | £324,950 |
No other historical records.
Apartment 59, Lockside House, Scotland Street, Birmingham B1 2BQ

| Today | See what it's worth now |
| 27 Nov 2023 | £295,950 |
No other historical records.
Find out how much your property is worth
The following agents can provide you with a free, no-obligation valuation. Simply select the ones you'd like to hear from.
Sponsored
All featured agents have paid a fee to promote their valuation expertise.

John Shepherd
Birmingham

FleetMilne
Birmingham

Dixons
Birmingham City Centre

Connells
Birmingham City

Yopa
North West & Midlands

LV PROPERTY
Birmingham
Get ready with a Mortgage in Principle
- Personalised result in just 20 minutes
- Find out how much you can borrow
- Get viewings faster with agents
- No impact on your credit score
What's your property worth?
Source Acknowledgement: © Crown copyright. England and Wales house price data is publicly available information produced by the HM Land Registry.This material was last updated on 2 December 2025. It covers the period from 1 January 1995 to 31 October 2025 and contains property transactions which have been registered during that period. Contains HM Land Registry data © Crown copyright and database right 2026. This data is licensed under the Open Government Licence v3.0.
Disclaimer: Rightmove.co.uk provides this HM Land Registry data "as is". The burden for fitness of the data relies completely with the user and is provided for informational purposes only. No warranty, express or implied, is given relating to the accuracy of content of the HM Land Registry data and Rightmove does not accept any liability for error or omission. If you have found an error with the data or need further information please contact HM Land Registry.
Permitted Use: Viewers of this Information are granted permission to access this Crown copyright material and to download it onto electronic, magnetic, optical or similar storage media provided that such activities are for private research, study or in-house use only. Any other use of the material requires the formal written permission of Land Registry which can be requested from us, and is subject to an additional licence and associated charge.
Data on planning applications, home extensions and build costs is provided by Resi.co.uk. Planning data is calculated using the last 2 years of residential applications within the selected planning authority. Home extension data, such as build costs and project timelines, are calculated using approximately 9,000 architectural projects Resi has completed, and 23,500 builders quotes submitted via Resi's platform. Build costs are adjusted according to inflation rates to more accurately represent today's prices.
Map data ©OpenStreetMap contributors.
Rightmove takes no liability for your use of, or reliance on, Rightmove's Instant Valuation due to the limitations of our tracking tool listed here. Use of this tool is taken entirely at your own risk. All rights reserved.

