
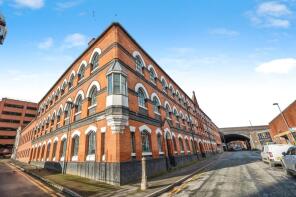
House Prices in B5
House prices in B5 have an overall average of £227,268 over the last year.
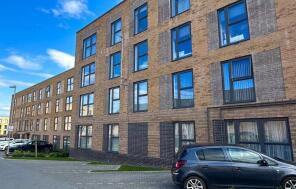
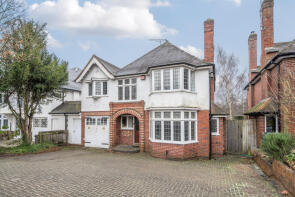
The majority of properties sold in B5 during the last year were flats, selling for an average price of £140,390. Terraced properties sold for an average of £315,667, with semi-detached properties fetching £760,000.
Overall, the historical sold prices in B5 over the last year were 8% down on the previous year and 16% down on the 2022 peak of £271,391.
Properties Sold
Apartment 107, 41, Essex Street, Birmingham B5 4TU
| Today | See what it's worth now |
| 2 Apr 2026 | £190,000 |
| 22 Jun 2009 | £136,863 |
No other historical records.
Apartment 64, 41, Essex Street, Birmingham B5 4TT
| Today | See what it's worth now |
| 24 Mar 2026 | £75,000 |
| 21 Dec 2009 | £81,614 |
No other historical records.
Apartment 83, 41, Essex Street, Birmingham B5 4TT
| Today | See what it's worth now |
| 16 Mar 2026 | £64,000 |
No other historical records.
Extensions and planning permission in B5
See planning approval stats, extension build costs and value added estimates.

Apartment 242, 24, The Ashes, Birmingham B5 7SB

| Today | See what it's worth now |
| 6 Mar 2026 | £135,000 |
| 30 Jan 2015 | £121,000 |
Apartment 63, 41, Essex Street, Birmingham B5 4TT

| Today | See what it's worth now |
| 27 Feb 2026 | £75,000 |
| 21 Dec 2009 | £81,614 |
No other historical records.
23, Belgravia Close, Birmingham B5 7LA
| Today | See what it's worth now |
| 26 Feb 2026 | £250,000 |
No other historical records.
163, Viceroy Close, Birmingham B5 7UX
| Today | See what it's worth now |
| 20 Feb 2026 | £210,000 |
| 5 Jul 2019 | £215,000 |
Apartment 35, 34 Cadbury House, St Lukes Road, Nechells, Birmingham B5 7BU
| Today | See what it's worth now |
| 13 Feb 2026 | £170,000 |
| 31 Jul 2020 | £190,000 |
No other historical records.
25, Benmore Avenue, Birmingham B5 7XN
| Today | See what it's worth now |
| 23 Jan 2026 | £305,000 |
| 2 Jun 2014 | £150,000 |
No other historical records.
11, Phoenix Court, West Drive, Edgbaston, Birmingham B5 7RT
| Today | See what it's worth now |
| 16 Jan 2026 | £68,200 |
| 23 Nov 2007 | £93,500 |
No other historical records.
165, Bristol Road, Edgbaston, Birmingham B5 7UA
| Today | See what it's worth now |
| 14 Jan 2026 | £342,000 |
| 17 Jun 2005 | £164,000 |
No other historical records.
179, Pershore Road, Edgbaston, Birmingham B5 7PF

| Today | See what it's worth now |
| 5 Jan 2026 | £330,000 |
| 28 Nov 1997 | £79,950 |
No other historical records.
88, 115 Michael Court, Bristol Road, Edgbaston, Birmingham B5 7TS

| Today | See what it's worth now |
| 5 Jan 2026 | £170,000 |
| 1 Sep 2008 | £120,000 |
Apartment 128, 15, The Boulevard, Edgbaston, Birmingham B5 7SU

| Today | See what it's worth now |
| 18 Dec 2025 | £97,000 |
| 20 Mar 2015 | £124,900 |
No other historical records.
Apartment 189, 90 Orion Building, Navigation Street, Birmingham B5 4AB
| Today | See what it's worth now |
| 12 Dec 2025 | £180,000 |
| 20 Nov 2006 | £234,950 |
No other historical records.
73, Elmwood Court, Pershore Road, Edgbaston, Birmingham B5 7PB
| Today | See what it's worth now |
| 5 Dec 2025 | £94,000 |
| 16 Feb 2024 | £85,000 |
Apartment 11, 24 Darwin House, Belgrave Middleway, Birmingham B5 7FG
| Today | See what it's worth now |
| 1 Dec 2025 | £237,000 |
| 30 Apr 2021 | £272,500 |
No other historical records.
Apartment 213, Dean House, Upper Dean Street, Birmingham B5 4SG
| Today | See what it's worth now |
| 25 Nov 2025 | £118,000 |
| 18 Sep 2014 | £113,000 |
Apartment 39, 41, Essex Street, Birmingham B5 4TT
| Today | See what it's worth now |
| 21 Nov 2025 | £140,000 |
| 14 Dec 2007 | £149,950 |
No other historical records.
346, Bristol Road, Edgbaston, Birmingham B5 7SN
| Today | See what it's worth now |
| 31 Oct 2025 | £705,000 |
| 8 Apr 2014 | £420,000 |
Apartment 53, 47, St Lukes Road, Nechells, Birmingham B5 7FN
| Today | See what it's worth now |
| 31 Oct 2025 | £210,000 |
| 25 Feb 2022 | £259,039 |
No other historical records.
21, Dalloway Close, Birmingham B5 7RD

| Today | See what it's worth now |
| 17 Oct 2025 | £155,000 |
| 13 Jul 2007 | £119,000 |
No other historical records.
Apartment 27, 78 The Brolly Works, Allison Street, Birmingham B5 5TH
| Today | See what it's worth now |
| 9 Oct 2025 | £162,500 |
| 1 Jan 2008 | £145,000 |
No other historical records.
Source Acknowledgement: © Crown copyright. England and Wales house price data is publicly available information produced by the HM Land Registry.This material was last updated on 9 July 2026. It covers the period from 1 January 1995 to 30 April 2026 and contains property transactions which have been registered during that period. Contains HM Land Registry data © Crown copyright and database right 2026. This data is licensed under the Open Government Licence v3.0.
Disclaimer: Rightmove.co.uk provides this HM Land Registry data "as is". The burden for fitness of the data relies completely with the user and is provided for informational purposes only. No warranty, express or implied, is given relating to the accuracy of content of the HM Land Registry data and Rightmove does not accept any liability for error or omission. If you have found an error with the data or need further information please contact HM Land Registry.
Permitted Use: Viewers of this Information are granted permission to access this Crown copyright material and to download it onto electronic, magnetic, optical or similar storage media provided that such activities are for private research, study or in-house use only. Any other use of the material requires the formal written permission of Land Registry which can be requested from us, and is subject to an additional licence and associated charge.
Rightmove takes no liability for your use of, or reliance on, Rightmove's Instant Valuation due to the limitations of our tracking tool listed here. Use of this tool is taken entirely at your own risk. All rights reserved.