
House Prices in B50
House prices in B50 have an overall average of £367,628 over the last year.
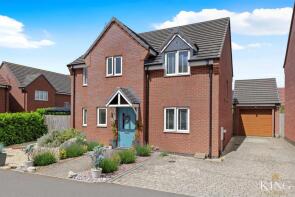
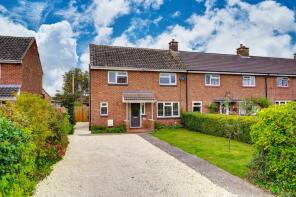
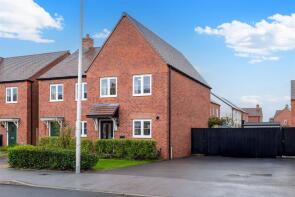
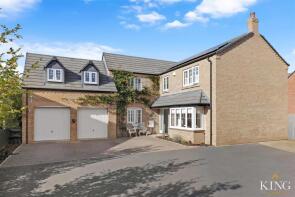
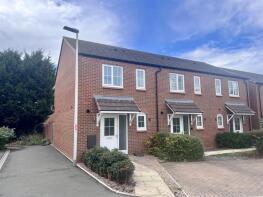
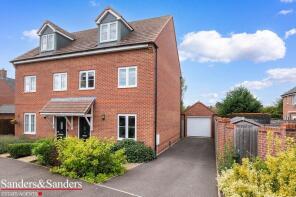
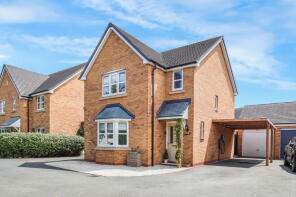
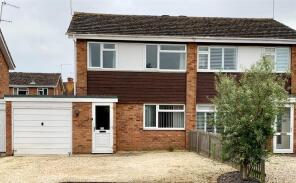
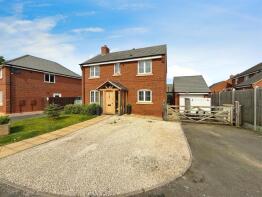
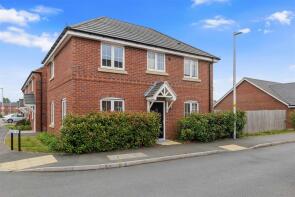
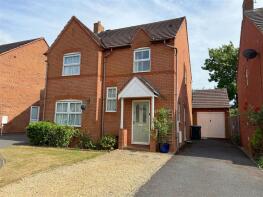
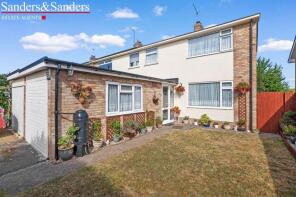
The majority of properties sold in B50 during the last year were detached properties, selling for an average price of £452,848. Semi-detached properties sold for an average of £299,272, with terraced properties fetching £255,643.
Overall, the historical sold prices in B50 over the last year were 5% up on the previous year and 4% up on the 2022 peak of £352,931.
Properties Sold
25, Jacksons Meadow, Alcester B50 4HQ

| Today | See what it's worth now |
| 8 Apr 2026 | £325,000 |
| 31 Mar 2017 | £232,950 |
No other historical records.
43, Tower Hill, Alcester B50 4DZ
| Today | See what it's worth now |
| 27 Mar 2026 | £285,000 |
| 31 Aug 2018 | £175,500 |
No other historical records.
8, Avon Way, Alcester B50 4GP
| Today | See what it's worth now |
| 27 Mar 2026 | £350,000 |
| 24 Nov 2017 | £269,725 |
No other historical records.
Extensions and planning permission in B50
See planning approval stats, extension build costs and value added estimates.

88, Damson Way, Alcester B50 4NB
| Today | See what it's worth now |
| 20 Mar 2026 | £360,000 |
| 18 Feb 2022 | £342,000 |
No other historical records.
47, The Meadows, Bidford-on-avon B50 4AP
| Today | See what it's worth now |
| 20 Mar 2026 | £310,000 |
No other historical records.
7, Queen Elizabeth Way, Alcester B50 4GN
| Today | See what it's worth now |
| 20 Mar 2026 | £467,500 |
| 25 Oct 2018 | £445,000 |
No other historical records.
17, Grafton Lane, Alcester B50 4DX
| Today | See what it's worth now |
| 13 Mar 2026 | £320,000 |
| 8 Mar 2024 | £276,000 |
34, Spearhead Road, Bidford-on-avon B50 4GT
| Today | See what it's worth now |
| 12 Mar 2026 | £298,000 |
No other historical records.
52, Chestnut Way, Alcester B50 4GF
| Today | See what it's worth now |
| 12 Mar 2026 | £540,000 |
| 13 Apr 2017 | £415,000 |
No other historical records.
5, Mirabelle Close, Alcester B50 4NE
| Today | See what it's worth now |
| 11 Mar 2026 | £250,000 |
| 18 Jul 2023 | £230,000 |
59, Avon Way, Alcester B50 4GP
| Today | See what it's worth now |
| 27 Feb 2026 | £240,000 |
| 29 Jun 2018 | £210,000 |
No other historical records.
44 Atlasta Cottage, High Street, Broom, Alcester B50 4HL
| Today | See what it's worth now |
| 27 Feb 2026 | £405,000 |
| 10 Dec 1999 | £138,000 |
16, Scott Close, Alcester B50 4HY
| Today | See what it's worth now |
| 27 Feb 2026 | £285,000 |
| 30 Apr 2018 | £210,000 |
7, Oak Place, Alcester B50 4GL
| Today | See what it's worth now |
| 27 Feb 2026 | £240,000 |
| 23 Sep 2016 | £191,995 |
No other historical records.
38, Jacksons Meadow, Alcester B50 4HQ
| Today | See what it's worth now |
| 26 Feb 2026 | £360,000 |
| 30 Jun 2017 | £264,950 |
No other historical records.
5, Avon Way, Alcester B50 4GP
| Today | See what it's worth now |
| 20 Feb 2026 | £385,000 |
| 25 Sep 2017 | £283,600 |
No other historical records.
5, Wessons Road, Alcester B50 4DR
| Today | See what it's worth now |
| 20 Feb 2026 | £255,000 |
| 8 Jun 2011 | £120,000 |
44, Damson Way, Alcester B50 4NB
| Today | See what it's worth now |
| 18 Feb 2026 | £350,000 |
| 27 Sep 2019 | £280,000 |
No other historical records.
73, Damson Way, Alcester B50 4NB
| Today | See what it's worth now |
| 9 Feb 2026 | £350,000 |
| 28 Jun 2021 | £327,000 |
No other historical records.
23, Ebsdorf Close, Alcester B50 4FQ
| Today | See what it's worth now |
| 9 Feb 2026 | £390,000 |
| 24 Aug 2017 | £290,000 |
12, Damson Way, Alcester B50 4NB

| Today | See what it's worth now |
| 6 Feb 2026 | £250,000 |
| 26 Nov 2021 | £236,000 |
20, Queensway, Bidford-on-avon B50 4BA
| Today | See what it's worth now |
| 6 Feb 2026 | £312,000 |
No other historical records.
54, Grafton Lane, Alcester B50 4DU
| Today | See what it's worth now |
| 5 Feb 2026 | £387,500 |
| 3 Nov 2023 | £319,950 |
Source Acknowledgement: © Crown copyright. England and Wales house price data is publicly available information produced by the HM Land Registry.This material was last updated on 9 July 2026. It covers the period from 1 January 1995 to 30 April 2026 and contains property transactions which have been registered during that period. Contains HM Land Registry data © Crown copyright and database right 2026. This data is licensed under the Open Government Licence v3.0.
Disclaimer: Rightmove.co.uk provides this HM Land Registry data "as is". The burden for fitness of the data relies completely with the user and is provided for informational purposes only. No warranty, express or implied, is given relating to the accuracy of content of the HM Land Registry data and Rightmove does not accept any liability for error or omission. If you have found an error with the data or need further information please contact HM Land Registry.
Permitted Use: Viewers of this Information are granted permission to access this Crown copyright material and to download it onto electronic, magnetic, optical or similar storage media provided that such activities are for private research, study or in-house use only. Any other use of the material requires the formal written permission of Land Registry which can be requested from us, and is subject to an additional licence and associated charge.
Rightmove takes no liability for your use of, or reliance on, Rightmove's Instant Valuation due to the limitations of our tracking tool listed here. Use of this tool is taken entirely at your own risk. All rights reserved.