
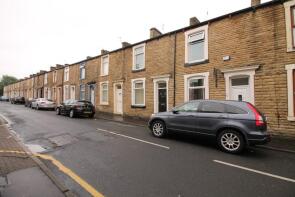
House Prices in BB11
House prices in BB11 have an overall average of £153,911 over the last year.
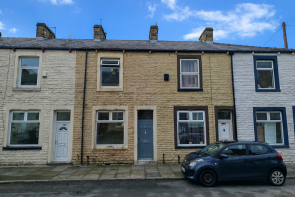
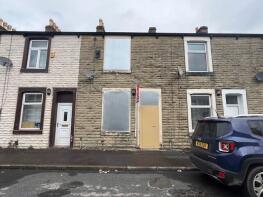
The majority of properties sold in BB11 during the last year were terraced properties, selling for an average price of £110,884. Semi-detached properties sold for an average of £183,061, with detached properties fetching £322,868.
Overall, the historical sold prices in BB11 over the last year were 8% up on the previous year and 17% up on the 2022 peak of £131,020.
Properties Sold
35, Villiers Street, Burnley BB11 5ER
| Today | See what it's worth now |
| 13 Apr 2026 | £73,000 |
| 19 Nov 2004 | £26,000 |
22, Moorland Road, Burnley BB11 2NY
| Today | See what it's worth now |
| 10 Apr 2026 | £140,000 |
| 28 Apr 2016 | £95,000 |
391, Manchester Road, Burnley BB11 4HE
| Today | See what it's worth now |
| 7 Apr 2026 | £186,000 |
| 20 Jul 2018 | £127,500 |
Extensions and planning permission in BB11
See planning approval stats, extension build costs and value added estimates.

24, Moorland Road, Burnley BB11 2NY
| Today | See what it's worth now |
| 2 Apr 2026 | £135,000 |
| 14 Aug 2020 | £82,000 |
29, Straight Mile Court, Burnley BB11 3DU
| Today | See what it's worth now |
| 29 Mar 2026 | £58,000 |
| 30 Nov 2007 | £104,525 |
No other historical records.
Flat 19, Albion Court, Albion Street, Burnley BB11 4LW
| Today | See what it's worth now |
| 27 Mar 2026 | £89,000 |
| 6 Feb 2004 | £47,950 |
11, Hillside, Burnley BB11 5JN

| Today | See what it's worth now |
| 27 Mar 2026 | £150,000 |
| 21 Sep 2007 | £114,000 |
1, Whiteacres Close, Burnley BB11 2JQ
| Today | See what it's worth now |
| 26 Mar 2026 | £380,000 |
| 16 Aug 2006 | £277,995 |
No other historical records.
7a, Glen View Road, Burnley BB11 2QL
| Today | See what it's worth now |
| 26 Mar 2026 | £180,000 |
| 17 Nov 2017 | £135,000 |
No other historical records.
16, Lansdowne Close, Burnley BB11 2JW
| Today | See what it's worth now |
| 25 Mar 2026 | £130,000 |
No other historical records.
6, Buttercross Close, Burnley BB11 5HB
| Today | See what it's worth now |
| 24 Mar 2026 | £302,500 |
| 25 Jan 2019 | £200,000 |
100, Dall Street, Burnley BB11 3LF
| Today | See what it's worth now |
| 24 Mar 2026 | £55,000 |
| 19 May 2016 | £32,000 |
72, Westgate, Burnley BB11 1RY
| Today | See what it's worth now |
| 20 Mar 2026 | £160,000 |
| 27 Apr 2001 | £28,000 |
No other historical records.
26, Smalley Street, Burnley BB11 3HH

| Today | See what it's worth now |
| 20 Mar 2026 | £75,000 |
| 1 May 2015 | £46,300 |
37, Reed Street, Burnley BB11 3LP
| Today | See what it's worth now |
| 19 Mar 2026 | £62,000 |
| 16 Oct 2025 | £47,000 |
170, Leyland Road, Burnley BB11 3DS

| Today | See what it's worth now |
| 18 Mar 2026 | £155,000 |
| 29 Jun 2007 | £154,950 |
No other historical records.
42, Lindsay Street, Burnley BB11 2SF
| Today | See what it's worth now |
| 10 Mar 2026 | £75,000 |
| 28 Feb 2019 | £48,500 |
Old Slate Cottage, Towneleyside, Todmorden Road, Burnley BB11 3QT
| Today | See what it's worth now |
| 10 Mar 2026 | £290,000 |
No other historical records.
5, Romney Avenue, Burnley BB11 2PG

| Today | See what it's worth now |
| 6 Mar 2026 | £132,000 |
| 20 Jun 2008 | £103,000 |
No other historical records.
Flat 2, Trinity Towers, Accrington Road, Burnley BB11 4AB
| Today | See what it's worth now |
| 6 Mar 2026 | £55,000 |
| 27 Mar 2020 | £41,500 |
5, Forest Street, Burnley BB11 2SA
| Today | See what it's worth now |
| 4 Mar 2026 | £79,000 |
| 1 Oct 2020 | £22,500 |
5, Hunslet Street, Burnley BB11 3DH
| Today | See what it's worth now |
| 3 Mar 2026 | £65,500 |
| 13 Oct 2025 | £35,000 |
32, Thurston Street, Burnley BB11 3DJ
| Today | See what it's worth now |
| 3 Mar 2026 | £127,000 |
| 9 Sep 2005 | £68,500 |

Source Acknowledgement: © Crown copyright. England and Wales house price data is publicly available information produced by the HM Land Registry.This material was last updated on 9 July 2026. It covers the period from 1 January 1995 to 30 April 2026 and contains property transactions which have been registered during that period. Contains HM Land Registry data © Crown copyright and database right 2026. This data is licensed under the Open Government Licence v3.0.
Disclaimer: Rightmove.co.uk provides this HM Land Registry data "as is". The burden for fitness of the data relies completely with the user and is provided for informational purposes only. No warranty, express or implied, is given relating to the accuracy of content of the HM Land Registry data and Rightmove does not accept any liability for error or omission. If you have found an error with the data or need further information please contact HM Land Registry.
Permitted Use: Viewers of this Information are granted permission to access this Crown copyright material and to download it onto electronic, magnetic, optical or similar storage media provided that such activities are for private research, study or in-house use only. Any other use of the material requires the formal written permission of Land Registry which can be requested from us, and is subject to an additional licence and associated charge.
Rightmove takes no liability for your use of, or reliance on, Rightmove's Instant Valuation due to the limitations of our tracking tool listed here. Use of this tool is taken entirely at your own risk. All rights reserved.