
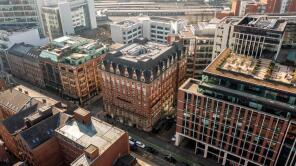
House Prices in Bagby Fields
House prices in Bagby Fields have an overall average of £165,600 over the last year.
Overall, the historical sold prices in Bagby Fields over the last year were 30% down on the previous year and 38% down on the 2011 peak of £266,469.
Properties Sold
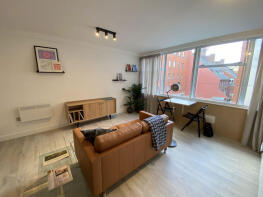
Flat 3, 16 Britannia House, York Place, Leeds LS1 2EU
| Today | See what it's worth now |
| 27 Mar 2026 | £108,000 |
| 26 Feb 2016 | £87,500 |
Flat 26, 22 Pearl Chambers, East Parade, Leeds LS1 2BH
| Today | See what it's worth now |
| 24 Feb 2026 | £185,000 |
| 20 Aug 2021 | £172,000 |
Flat 35, 11, Park Row, Leeds LS1 5HB

| Today | See what it's worth now |
| 17 Dec 2025 | £140,000 |
| 12 Aug 2002 | £137,000 |
No other historical records.
156, West Point, Wellington Street, Leeds LS1 4JL
| Today | See what it's worth now |
| 4 Dec 2025 | £135,000 |
| 1 Nov 2006 | £193,000 |
No other historical records.
Apartment 23, 22, York Place, Leeds LS1 2EX
| Today | See what it's worth now |
| 24 Nov 2025 | £75,000 |
| 11 Jan 2008 | £189,508 |
No other historical records.
52, 27 City Central, Wellington Street, Leeds LS1 4EA
| Today | See what it's worth now |
| 2 Oct 2025 | £148,000 |
| 9 Apr 2015 | £120,000 |
56, 27 City Central, Wellington Street, Leeds LS1 4EA
| Today | See what it's worth now |
| 19 Sep 2025 | £305,000 |
| 10 Oct 2003 | £190,100 |
No other historical records.
24, West Point, Wellington Street, Leeds LS1 4JJ
| Today | See what it's worth now |
| 29 Aug 2025 | £55,000 |
| 1 Feb 2006 | £90,000 |
No other historical records.
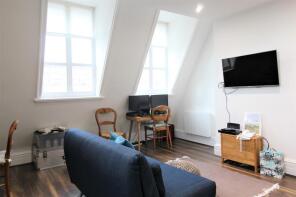
Flat 22, 14, Park Row, Leeds LS1 5HU

| Today | See what it's worth now |
| 11 Jul 2025 | £195,000 |
| 13 Aug 1999 | £97,000 |
No other historical records.
Flat 14, 19, Wellington Street, Leeds LS1 4JF
| Today | See what it's worth now |
| 1 Jul 2025 | £310,000 |
| 4 Jul 2006 | £225,000 |
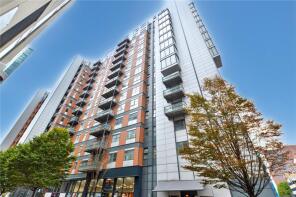
Flat 28, 1, Dock Street, Leeds LS10 1NA

| Today | See what it's worth now |
| 11 Jun 2025 | £450,000 |
| 21 Dec 2020 | £350,000 |
Flat 43, 1, Dock Street, Leeds LS10 1NA
| Today | See what it's worth now |
| 28 Feb 2025 | £198,000 |
No other historical records.
Flat 7, 1, Dock Street, Leeds LS10 1NA

| Today | See what it's worth now |
| 14 Feb 2025 | £162,000 |
| 2 Sep 2005 | £150,000 |
1, 27 City Central, Wellington Street, Leeds LS1 4EA

| Today | See what it's worth now |
| 3 Feb 2025 | £255,000 |
| 4 Apr 2018 | £200,000 |
Apartment 7, 49a, St Pauls Street, Leeds LS1 2FL

| Today | See what it's worth now |
| 9 Dec 2024 | £204,500 |
| 20 Sep 2019 | £198,000 |
No other historical records.
Flat 32, 16 Britannia House, York Place, Leeds LS1 2EU
| Today | See what it's worth now |
| 20 Nov 2024 | £70,000 |
| 25 Jun 2004 | £81,000 |
Flat 2, 10 11, York Place, Leeds LS1 2DS
| Today | See what it's worth now |
| 4 Oct 2024 | £335,000 |
| 14 Jan 2005 | £270,000 |
Apartment 21, 22, York Place, Leeds LS1 2EX
| Today | See what it's worth now |
| 10 Jul 2024 | £125,700 |
| 14 Jan 2008 | £191,305 |
No other historical records.
176, West Point, Wellington Street, Leeds LS1 4JL

| Today | See what it's worth now |
| 21 Jun 2024 | £167,500 |
| 26 Apr 2011 | £150,000 |
No other historical records.
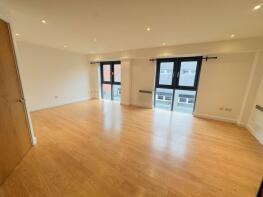
Flat 3, 42, Park Square North, Leeds LS1 2NP

| Today | See what it's worth now |
| 3 Jun 2024 | £385,000 |
| 13 Jul 2018 | £330,000 |
No other historical records.
Flat 10, 15, South Parade, Leeds LS1 5PQ

| Today | See what it's worth now |
| 10 May 2024 | £215,000 |
| 27 Feb 2009 | £150,000 |
53, 27 City Central, Wellington Street, Leeds LS1 4EA
| Today | See what it's worth now |
| 3 May 2024 | £205,000 |
| 24 Jun 2003 | £178,500 |
No other historical records.
Flat 5, 30, York Place, Leeds LS1 2RL

| Today | See what it's worth now |
| 13 Mar 2024 | £180,000 |
| 5 Jun 2015 | £133,500 |
Source Acknowledgement: © Crown copyright. England and Wales house price data is publicly available information produced by the HM Land Registry.This material was last updated on 9 July 2026. It covers the period from 1 January 1995 to 30 April 2026 and contains property transactions which have been registered during that period. Contains HM Land Registry data © Crown copyright and database right 2026. This data is licensed under the Open Government Licence v3.0.
Disclaimer: Rightmove.co.uk provides this HM Land Registry data "as is". The burden for fitness of the data relies completely with the user and is provided for informational purposes only. No warranty, express or implied, is given relating to the accuracy of content of the HM Land Registry data and Rightmove does not accept any liability for error or omission. If you have found an error with the data or need further information please contact HM Land Registry.
Permitted Use: Viewers of this Information are granted permission to access this Crown copyright material and to download it onto electronic, magnetic, optical or similar storage media provided that such activities are for private research, study or in-house use only. Any other use of the material requires the formal written permission of Land Registry which can be requested from us, and is subject to an additional licence and associated charge.
Rightmove takes no liability for your use of, or reliance on, Rightmove's Instant Valuation due to the limitations of our tracking tool listed here. Use of this tool is taken entirely at your own risk. All rights reserved.