
House Prices in Batworthy
House prices in Batworthy have an overall average of £465,016 over the last year.
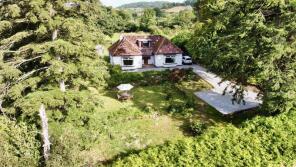
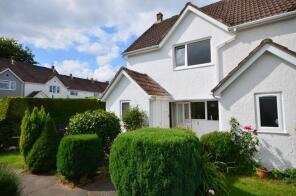
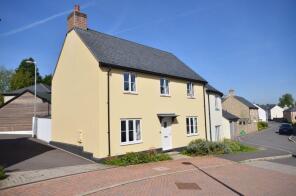
The majority of properties sold in Batworthy during the last year were detached properties, selling for an average price of £541,833. Semi-detached properties sold for an average of £484,643, with terraced properties fetching £375,429.
Overall, the historical sold prices in Batworthy over the last year were 17% down on the previous year and 12% down on the 2023 peak of £527,474.
Properties Sold
28, Forder Meadow, Newton Abbot TQ13 8JB

| Today | See what it's worth now |
| 6 Mar 2026 | £317,500 |
| 18 Mar 2004 | £174,949 |
No other historical records.
24, Fore Street, Moretonhampstead TQ13 8LL
| Today | See what it's worth now |
| 27 Feb 2026 | £222,000 |
No other historical records.
St Levan, Broomhill, Newton Abbot TQ13 8DD
| Today | See what it's worth now |
| 18 Feb 2026 | £735,000 |
| 1 Jul 2011 | £700,000 |
2, Steward Barns, Road Past Steward Farm, Newton Abbot TQ13 8SD

| Today | See what it's worth now |
| 16 Feb 2026 | £425,000 |
| 27 Sep 2018 | £335,000 |
2, Lamb Park, Newton Abbot TQ13 8DN
| Today | See what it's worth now |
| 11 Feb 2026 | £310,000 |
| 20 Nov 2020 | £259,000 |
16, Turnlake Road, Newton Abbot TQ13 8FF
| Today | See what it's worth now |
| 30 Jan 2026 | £422,000 |
| 31 Oct 2019 | £312,000 |
No other historical records.
6, Lords Meadow, Newton Abbot TQ13 8FS
| Today | See what it's worth now |
| 28 Jan 2026 | £650,000 |
| 17 Mar 2023 | £550,000 |
No other historical records.
Brimstone Down, Road From Batworthy Farm To Southill Cross, Newton Abbot TQ13 8ET
| Today | See what it's worth now |
| 20 Jan 2026 | £1,120,000 |
| 31 Jan 2018 | £801,000 |
4, Sawyers Close, Newton Abbot TQ13 8FD
| Today | See what it's worth now |
| 16 Jan 2026 | £137,500 |
| 29 Sep 2016 | £125,000 |
1, Prouse Avenue, Newton Abbot TQ13 8FL
| Today | See what it's worth now |
| 5 Jan 2026 | £475,000 |
| 28 Feb 2020 | £385,000 |
No other historical records.
St Johns East, Murchington, Chagford TQ13 8HJ
| Today | See what it's worth now |
| 5 Jan 2026 | £525,000 |
No other historical records.
18, Fore Street, Newton Abbot TQ13 8LL
| Today | See what it's worth now |
| 19 Dec 2025 | £412,500 |
| 13 Jan 2004 | £235,000 |
No other historical records.
12, Hingston View, Newton Abbot TQ13 8FW
| Today | See what it's worth now |
| 19 Dec 2025 | £410,000 |
| 25 Nov 2022 | £419,995 |
No other historical records.
43 Knotts Berry Cottage, New Street, Newton Abbot TQ13 8BB
| Today | See what it's worth now |
| 10 Dec 2025 | £500,000 |
| 4 Apr 2008 | £230,000 |
No other historical records.
6, Great Tree Park, Newton Abbot TQ13 8JP
| Today | See what it's worth now |
| 24 Nov 2025 | £515,000 |
| 11 Nov 2005 | £435,000 |
No other historical records.
Cherry Tree Farmhouse, Road From Bughead Cross To Court Street, Newton Abbot TQ13 8PN
| Today | See what it's worth now |
| 20 Nov 2025 | £610,000 |
| 9 Nov 2017 | £457,500 |
Newlands, North Bovey Road, Newton Abbot TQ13 8PA
| Today | See what it's worth now |
| 14 Nov 2025 | £520,000 |
| 8 Aug 2007 | £375,000 |
No other historical records.
16, The Glebelands, Moretonhampstead TQ13 8LE
| Today | See what it's worth now |
| 20 Oct 2025 | £465,000 |
No other historical records.
30, The Square, Newton Abbot TQ13 8AB
| Today | See what it's worth now |
| 17 Oct 2025 | £400,000 |
| 3 Jul 2019 | £250,000 |
31, Lamb Park, Newton Abbot TQ13 8DN
| Today | See what it's worth now |
| 17 Oct 2025 | £395,000 |
| 11 Feb 2022 | £350,000 |
Flat 5, Meldon Hall, Road From Meldon Road To Weddicott Cross, Newton Abbot TQ13 8EJ
| Today | See what it's worth now |
| 10 Oct 2025 | £195,000 |
| 11 Apr 2013 | £137,500 |
Furzebeam, Broomhill, Newton Abbot TQ13 8DD
| Today | See what it's worth now |
| 10 Oct 2025 | £565,000 |
| 3 Apr 2023 | £440,000 |
No other historical records.
5, Lamb Park, Newton Abbot TQ13 8DN
| Today | See what it's worth now |
| 10 Oct 2025 | £261,500 |
| 24 Sep 1999 | £65,000 |
No other historical records.
Source Acknowledgement: © Crown copyright. England and Wales house price data is publicly available information produced by the HM Land Registry.This material was last updated on 9 July 2026. It covers the period from 1 January 1995 to 30 April 2026 and contains property transactions which have been registered during that period. Contains HM Land Registry data © Crown copyright and database right 2026. This data is licensed under the Open Government Licence v3.0.
Disclaimer: Rightmove.co.uk provides this HM Land Registry data "as is". The burden for fitness of the data relies completely with the user and is provided for informational purposes only. No warranty, express or implied, is given relating to the accuracy of content of the HM Land Registry data and Rightmove does not accept any liability for error or omission. If you have found an error with the data or need further information please contact HM Land Registry.
Permitted Use: Viewers of this Information are granted permission to access this Crown copyright material and to download it onto electronic, magnetic, optical or similar storage media provided that such activities are for private research, study or in-house use only. Any other use of the material requires the formal written permission of Land Registry which can be requested from us, and is subject to an additional licence and associated charge.
Rightmove takes no liability for your use of, or reliance on, Rightmove's Instant Valuation due to the limitations of our tracking tool listed here. Use of this tool is taken entirely at your own risk. All rights reserved.