
House Prices in Berry Down
House prices in Berry Down have an overall average of £436,747 over the last year.
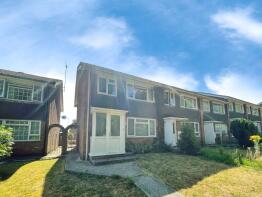
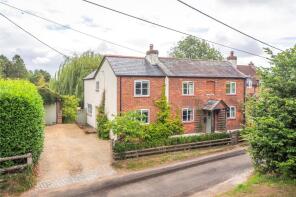
The majority of properties sold in Berry Down during the last year were terraced properties, selling for an average price of £296,020. Detached properties sold for an average of £678,958, with semi-detached properties fetching £418,329.
Overall, the historical sold prices in Berry Down over the last year were 7% down on the previous year and 26% down on the 2023 peak of £593,716.
Properties Sold
70, Buckland Avenue, Basingstoke RG22 6JA
| Today | See what it's worth now |
| 17 Mar 2026 | £325,000 |
| 27 Jul 1995 | £79,995 |
No other historical records.
4, Bible Fields, Basingstoke RG25 2AN
| Today | See what it's worth now |
| 12 Mar 2026 | £475,000 |
| 5 Nov 2020 | £410,000 |
6, St Michaels Close, Basingstoke RG25 2BP
| Today | See what it's worth now |
| 11 Mar 2026 | £680,000 |
| 28 Jun 2019 | £490,000 |
No other historical records.
19, Stag Hill, Basingstoke RG22 6JF
| Today | See what it's worth now |
| 10 Mar 2026 | £335,000 |
No other historical records.
30, Scarlatti Road, Basingstoke RG22 4LY
| Today | See what it's worth now |
| 25 Feb 2026 | £215,000 |
| 5 Jun 2015 | £158,000 |
13, Buckland Avenue, Basingstoke RG22 6JH
| Today | See what it's worth now |
| 30 Jan 2026 | £420,000 |
| 22 Feb 2016 | £330,000 |
Meadow House, Church Lane, Basingstoke RG25 2EN

| Today | See what it's worth now |
| 26 Jan 2026 | £2,359,000 |
| 18 Sep 2009 | £600,000 |
118, Borodin Close, Basingstoke RG22 4EW
| Today | See what it's worth now |
| 26 Jan 2026 | £315,000 |
| 9 Mar 2018 | £264,000 |
23, Ketelbey Rise, Basingstoke RG22 4PE

| Today | See what it's worth now |
| 23 Jan 2026 | £450,000 |
| 19 Feb 2003 | £223,000 |
No other historical records.
9, Denham Drive, Basingstoke RG22 6LT
| Today | See what it's worth now |
| 16 Jan 2026 | £451,000 |
| 28 Jun 2019 | £385,000 |
130, Britten Road, Basingstoke RG22 4HP
| Today | See what it's worth now |
| 16 Jan 2026 | £320,000 |
| 4 Mar 2021 | £278,000 |
Laurel Cottage, Dummer Down Lane, Basingstoke RG25 2AW
| Today | See what it's worth now |
| 16 Jan 2026 | £960,000 |
| 28 Apr 2011 | £475,000 |
No other historical records.
Valley House, Farleigh Road, Preston Candover RG25 2DN
| Today | See what it's worth now |
| 15 Jan 2026 | £1,138,750 |
No other historical records.
1, Whitegates, Farleigh Road, Basingstoke RG25 2DN
| Today | See what it's worth now |
| 15 Jan 2026 | £862,000 |
| 10 Jan 2022 | £750,000 |
30, Cumberland Avenue, Basingstoke RG22 4BQ
| Today | See what it's worth now |
| 14 Jan 2026 | £562,000 |
No other historical records.
36, Ketelbey Rise, Basingstoke RG22 4PE
| Today | See what it's worth now |
| 19 Dec 2025 | £215,000 |
| 1 Jun 2016 | £162,500 |
108, Borodin Close, Basingstoke RG22 4EW

| Today | See what it's worth now |
| 19 Dec 2025 | £297,000 |
| 18 Dec 2000 | £105,000 |
No other historical records.
18, Delius Close, Basingstoke RG22 4DS
| Today | See what it's worth now |
| 19 Dec 2025 | £323,000 |
| 28 Oct 2005 | £168,000 |
No other historical records.
1, Clump Cottages, Alton Road, Basingstoke RG25 2NF
| Today | See what it's worth now |
| 18 Dec 2025 | £455,000 |
| 1 May 2007 | £210,000 |
No other historical records.
16, School Close, Basingstoke RG22 5FY
| Today | See what it's worth now |
| 17 Dec 2025 | £315,000 |
| 20 Aug 2010 | £195,000 |
35, Berkeley Drive, Basingstoke RG22 4NS
| Today | See what it's worth now |
| 17 Dec 2025 | £295,000 |
| 20 Aug 2012 | £167,000 |
6, Meadow Rise, Basingstoke RG25 2SU
| Today | See what it's worth now |
| 12 Dec 2025 | £425,000 |
| 24 Nov 1997 | £123,000 |
No other historical records.
1, Primrose Close, Basingstoke RG25 2FJ
| Today | See what it's worth now |
| 3 Dec 2025 | £297,593 |
| 13 Jan 2021 | £335,000 |
No other historical records.
Source Acknowledgement: © Crown copyright. England and Wales house price data is publicly available information produced by the HM Land Registry.This material was last updated on 9 July 2026. It covers the period from 1 January 1995 to 30 April 2026 and contains property transactions which have been registered during that period. Contains HM Land Registry data © Crown copyright and database right 2026. This data is licensed under the Open Government Licence v3.0.
Disclaimer: Rightmove.co.uk provides this HM Land Registry data "as is". The burden for fitness of the data relies completely with the user and is provided for informational purposes only. No warranty, express or implied, is given relating to the accuracy of content of the HM Land Registry data and Rightmove does not accept any liability for error or omission. If you have found an error with the data or need further information please contact HM Land Registry.
Permitted Use: Viewers of this Information are granted permission to access this Crown copyright material and to download it onto electronic, magnetic, optical or similar storage media provided that such activities are for private research, study or in-house use only. Any other use of the material requires the formal written permission of Land Registry which can be requested from us, and is subject to an additional licence and associated charge.
Rightmove takes no liability for your use of, or reliance on, Rightmove's Instant Valuation due to the limitations of our tracking tool listed here. Use of this tool is taken entirely at your own risk. All rights reserved.