
House Prices in Betterton
House prices in Betterton have an overall average of £416,951 over the last year.
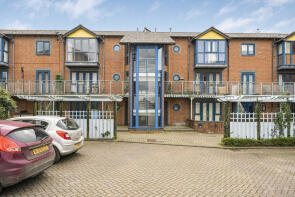
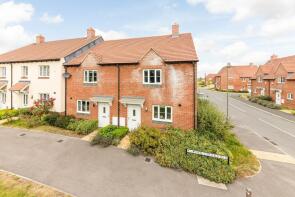
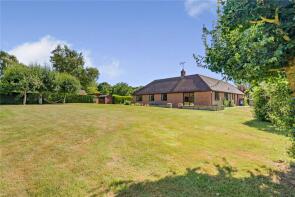
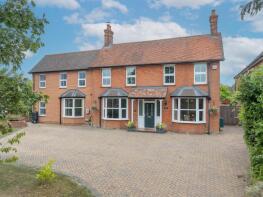
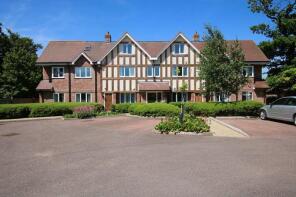
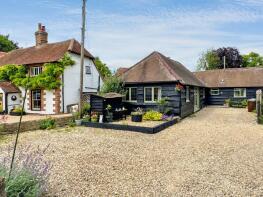
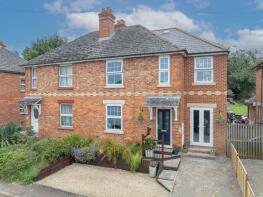
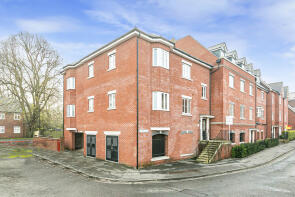
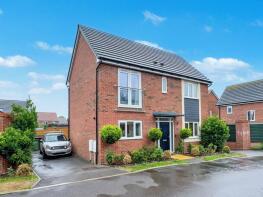
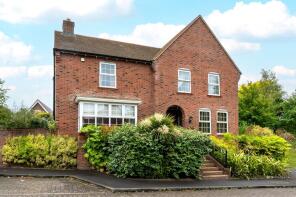
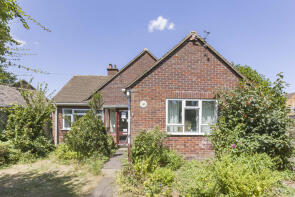
The majority of properties sold in Betterton during the last year were detached properties, selling for an average price of £598,395. Semi-detached properties sold for an average of £377,338, with flats fetching £203,568.
Overall, the historical sold prices in Betterton over the last year were 2% down on the previous year and 7% down on the 2023 peak of £448,796.
Properties Sold
Apartment 1, 16 The Woolpack, Church Street, Wantage OX12 8BL
| Today | See what it's worth now |
| 25 Mar 2026 | £180,750 |
| 21 Jul 2017 | £170,000 |
No other historical records.
52, Charlton Road, Wantage OX12 8HG
| Today | See what it's worth now |
| 17 Mar 2026 | £525,000 |
| 21 Jan 2011 | £325,000 |
32, Charlton Road, Wantage OX12 8HG
| Today | See what it's worth now |
| 20 Feb 2026 | £500,000 |
No other historical records.
39, Chapel Close, Wantage OX12 7DY
| Today | See what it's worth now |
| 17 Feb 2026 | £370,000 |
| 4 Mar 2021 | £305,000 |
33, Alfredston Place, Wantage OX12 8DL
| Today | See what it's worth now |
| 13 Feb 2026 | £152,000 |
| 13 Mar 1998 | £56,500 |
No other historical records.
3, Gabriel House, Newbury Street, Wantage OX12 8DJ

| Today | See what it's worth now |
| 13 Feb 2026 | £237,000 |
| 2 Feb 2018 | £220,000 |
4, Ridgeway Close, East Hendred, Wantage OX12 8GF
| Today | See what it's worth now |
| 6 Feb 2026 | £317,000 |
No other historical records.
Flat 3, Market Gate, Post Office Lane, Wantage OX12 8DR
| Today | See what it's worth now |
| 23 Jan 2026 | £130,000 |
| 30 Aug 2019 | £130,000 |
No other historical records.
42, Sedge Smith Way, Wantage OX12 8GL
| Today | See what it's worth now |
| 23 Jan 2026 | £107,500 |
No other historical records.
Tyneham, Ginge Road, West Hendred, Wantage OX12 8RP
| Today | See what it's worth now |
| 12 Jan 2026 | £785,000 |
No other historical records.
9, Badgers Gardens, Charlton Road, Wantage OX12 8FE

| Today | See what it's worth now |
| 9 Jan 2026 | £215,000 |
| 18 Oct 2013 | £180,000 |
No other historical records.
66, Charlton Road, Wantage OX12 8HG
| Today | See what it's worth now |
| 5 Jan 2026 | £1,150,000 |
| 26 May 2009 | £480,000 |
No other historical records.
4, Badgers Gardens, Charlton Road, Wantage OX12 8FE
| Today | See what it's worth now |
| 18 Dec 2025 | £251,250 |
| 10 May 2019 | £220,000 |
The Croft Barn, Church Street, East Hendred, Wantage OX12 8LA
| Today | See what it's worth now |
| 4 Dec 2025 | £495,000 |
| 27 Jan 2006 | £285,650 |
64, Orchard Way, Wantage OX12 8EB
| Today | See what it's worth now |
| 3 Dec 2025 | £457,000 |
| 27 Jun 2007 | £220,000 |
15, Little Lane, Wantage OX12 8FY
| Today | See what it's worth now |
| 21 Nov 2025 | £204,000 |
| 21 Dec 2017 | £225,000 |
No other historical records.
19, Coates Close, Wantage OX12 8GH
| Today | See what it's worth now |
| 21 Nov 2025 | £390,000 |
| 29 Nov 2019 | £364,995 |
No other historical records.
Winslow Hall, 47a, Newbury Street, Wantage OX12 8DJ
| Today | See what it's worth now |
| 14 Nov 2025 | £210,000 |
| 24 Apr 2020 | £182,500 |
2, Humphries Green, Wantage OX12 8FU
| Today | See what it's worth now |
| 13 Nov 2025 | £715,000 |
| 22 Oct 2015 | £549,950 |
No other historical records.
Westbury, Orchard Close, East Hendred, Wantage OX12 8JJ
| Today | See what it's worth now |
| 11 Nov 2025 | £360,000 |
No other historical records.
Mereworth, Springfield Road, Wantage OX12 8HB
| Today | See what it's worth now |
| 7 Nov 2025 | £335,000 |
No other historical records.
32, Mary Shunn Way, Wantage OX12 8GN
| Today | See what it's worth now |
| 7 Nov 2025 | £650,000 |
| 11 Apr 2022 | £599,995 |
No other historical records.
37, Palmers, Wantage OX12 7HA
| Today | See what it's worth now |
| 6 Nov 2025 | £325,000 |
| 2 Aug 2019 | £275,000 |
Source Acknowledgement: © Crown copyright. England and Wales house price data is publicly available information produced by the HM Land Registry.This material was last updated on 15 May 2026. It covers the period from 1 January 1995 to 31 March 2026 and contains property transactions which have been registered during that period. Contains HM Land Registry data © Crown copyright and database right 2026. This data is licensed under the Open Government Licence v3.0.
Disclaimer: Rightmove.co.uk provides this HM Land Registry data "as is". The burden for fitness of the data relies completely with the user and is provided for informational purposes only. No warranty, express or implied, is given relating to the accuracy of content of the HM Land Registry data and Rightmove does not accept any liability for error or omission. If you have found an error with the data or need further information please contact HM Land Registry.
Permitted Use: Viewers of this Information are granted permission to access this Crown copyright material and to download it onto electronic, magnetic, optical or similar storage media provided that such activities are for private research, study or in-house use only. Any other use of the material requires the formal written permission of Land Registry which can be requested from us, and is subject to an additional licence and associated charge.
Rightmove takes no liability for your use of, or reliance on, Rightmove's Instant Valuation due to the limitations of our tracking tool listed here. Use of this tool is taken entirely at your own risk. All rights reserved.