
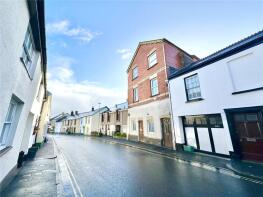
House Prices in Bibbear
House prices in Bibbear have an overall average of £268,833 over the last year.
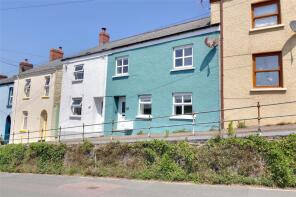
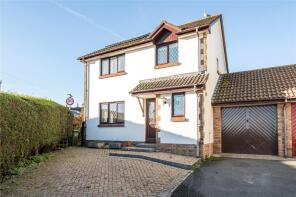
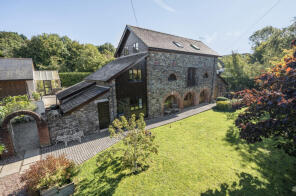
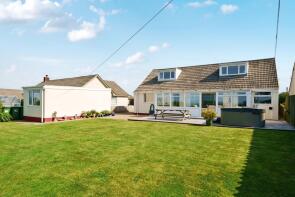
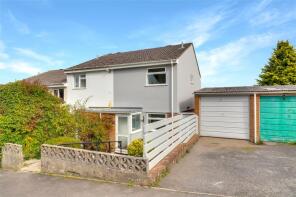
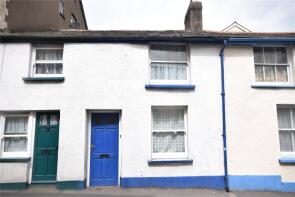
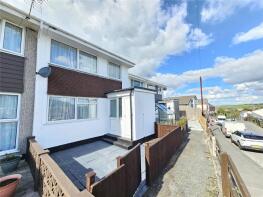
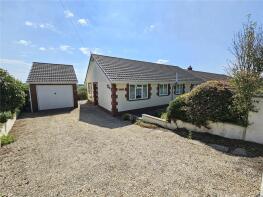
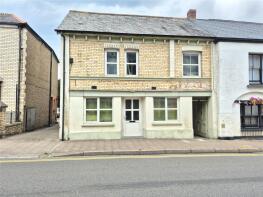
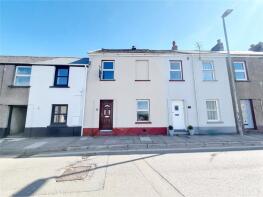
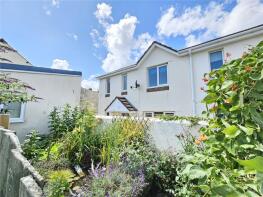
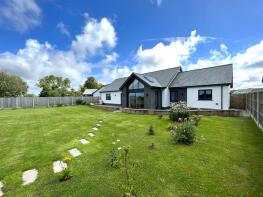
The majority of properties sold in Bibbear during the last year were terraced properties, selling for an average price of £212,375. Detached properties sold for an average of £375,559, with semi-detached properties fetching £269,571.
Overall, the historical sold prices in Bibbear over the last year were 13% down on the previous year and 10% down on the 2021 peak of £298,954.
Properties Sold
Flat 2, 13, Well Street, Torrington EX38 8EP
| Today | See what it's worth now |
| 15 Apr 2026 | £75,000 |
| 23 Mar 2007 | £66,000 |
No other historical records.
6, Castle Street, Torrington EX38 8EZ
| Today | See what it's worth now |
| 2 Apr 2026 | £210,000 |
| 8 Feb 2001 | £60,000 |
No other historical records.
Badgers Barn, Road To Withacott Farm House, Torrington EX38 8NL
| Today | See what it's worth now |
| 31 Mar 2026 | £415,000 |
| 29 Jan 2021 | £390,000 |
42, Mill Street, Torrington EX38 8AN
| Today | See what it's worth now |
| 23 Mar 2026 | £190,000 |
| 30 Apr 2019 | £170,000 |
44, Holwill Drive, Torrington EX38 7LQ
| Today | See what it's worth now |
| 20 Mar 2026 | £265,000 |
| 27 Sep 2024 | £258,000 |
24, Rack Park Close, Torrington EX38 8AH

| Today | See what it's worth now |
| 16 Mar 2026 | £195,500 |
| 14 Apr 2011 | £162,000 |
No other historical records.
Staple Barton, Road Over Old Rothern Bridge, Torrington EX38 8JD
| Today | See what it's worth now |
| 27 Feb 2026 | £640,000 |
| 30 Aug 2016 | £510,000 |
91, New Street, Torrington EX38 8BT
| Today | See what it's worth now |
| 16 Feb 2026 | £125,000 |
No other historical records.
7 Grenville House, Whites Lane, Torrington EX38 8DS
| Today | See what it's worth now |
| 4 Feb 2026 | £290,000 |
| 2 Dec 2015 | £160,000 |
No other historical records.
Pendene, Church Lane, Frithelstockstone EX38 8JL
| Today | See what it's worth now |
| 16 Jan 2026 | £440,000 |
No other historical records.
Windsor House, New Road, Torrington EX38 8EJ
| Today | See what it's worth now |
| 14 Jan 2026 | £565,000 |
No other historical records.
111, Castle Hill Gardens, Torrington EX38 8EX
| Today | See what it's worth now |
| 8 Jan 2026 | £225,000 |
| 3 Nov 2000 | £57,000 |
No other historical records.
8, Well Street, Torrington EX38 8EP
| Today | See what it's worth now |
| 8 Jan 2026 | £163,000 |
| 7 Jun 2018 | £115,500 |
21, Heathland View, Torrington EX38 8RB
| Today | See what it's worth now |
| 19 Dec 2025 | £420,000 |
| 28 Nov 2014 | £180,000 |
No other historical records.
2, School Lane, Torrington EX38 7AJ
| Today | See what it's worth now |
| 17 Dec 2025 | £220,000 |
| 7 Apr 2000 | £57,000 |
Sebring, Church Meadow, Langtree EX38 8RS
| Today | See what it's worth now |
| 15 Dec 2025 | £310,000 |
| 1 Sep 2003 | £187,500 |
74a, New Street, Torrington EX38 8BS
| Today | See what it's worth now |
| 15 Dec 2025 | £135,000 |
No other historical records.
Narellan, Mill Street, Torrington EX38 8AL
| Today | See what it's worth now |
| 11 Dec 2025 | £175,000 |
| 3 May 2019 | £120,000 |
176, New Street, Torrington EX38 8BX
| Today | See what it's worth now |
| 5 Dec 2025 | £220,000 |
| 8 Jan 2021 | £170,000 |
4, Bluecoat Villas, Torrington EX38 8AP
| Today | See what it's worth now |
| 2 Dec 2025 | £240,000 |
| 20 May 2019 | £190,000 |
Flat 1, 30, Well Street, Torrington EX38 8EP
| Today | See what it's worth now |
| 1 Dec 2025 | £95,000 |
| 1 Jul 2021 | £82,000 |
Flat 4, Heywood House, South Street, Torrington EX38 8HF
| Today | See what it's worth now |
| 4 Nov 2025 | £80,000 |
| 9 Jul 2021 | £75,000 |
99, New Street, Torrington EX38 8BU
| Today | See what it's worth now |
| 4 Nov 2025 | £170,000 |
| 28 Feb 2002 | £74,950 |
No other historical records.
Source Acknowledgement: © Crown copyright. England and Wales house price data is publicly available information produced by the HM Land Registry.This material was last updated on 9 July 2026. It covers the period from 1 January 1995 to 30 April 2026 and contains property transactions which have been registered during that period. Contains HM Land Registry data © Crown copyright and database right 2026. This data is licensed under the Open Government Licence v3.0.
Disclaimer: Rightmove.co.uk provides this HM Land Registry data "as is". The burden for fitness of the data relies completely with the user and is provided for informational purposes only. No warranty, express or implied, is given relating to the accuracy of content of the HM Land Registry data and Rightmove does not accept any liability for error or omission. If you have found an error with the data or need further information please contact HM Land Registry.
Permitted Use: Viewers of this Information are granted permission to access this Crown copyright material and to download it onto electronic, magnetic, optical or similar storage media provided that such activities are for private research, study or in-house use only. Any other use of the material requires the formal written permission of Land Registry which can be requested from us, and is subject to an additional licence and associated charge.
Rightmove takes no liability for your use of, or reliance on, Rightmove's Instant Valuation due to the limitations of our tracking tool listed here. Use of this tool is taken entirely at your own risk. All rights reserved.