
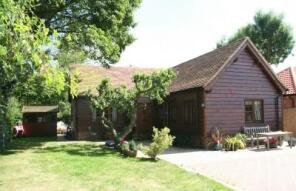
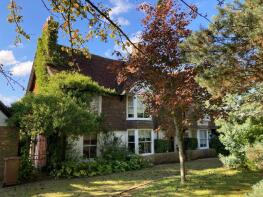
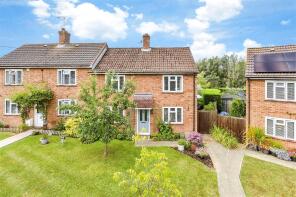
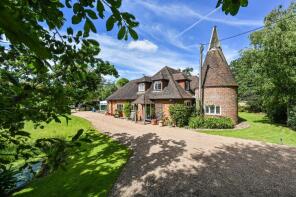
House Prices in Biddenden
House prices in Biddenden have an overall average of £576,711 over the last year.
The majority of properties sold in Biddenden during the last year were detached properties, selling for an average price of £799,944. Semi-detached properties sold for an average of £403,833, with terraced properties fetching £333,750.
Overall, the historical sold prices in Biddenden over the last year were 10% up on the previous year and 11% down on the 2023 peak of £646,062.
Properties Sold
3b The Barn, Old Mill Court, Ashford TN27 8DD
| Today | See what it's worth now |
| 26 Nov 2025 | £510,000 |
| 27 Feb 2012 | £430,000 |
7, Chulkhurst, Ashford TN27 8ED

| Today | See what it's worth now |
| 21 Nov 2025 | £425,000 |
| 28 Jun 2021 | £410,000 |
29 Mansion House, North Street, Ashford TN27 8AG
| Today | See what it's worth now |
| 31 Oct 2025 | £570,000 |
| 7 Feb 2003 | £382,000 |
22, The Meadows, Ashford TN27 8AW
| Today | See what it's worth now |
| 30 Oct 2025 | £340,000 |
| 29 Aug 2012 | £191,000 |
Little Standen Oast, Smarden Road, Ashford TN27 8JT
| Today | See what it's worth now |
| 30 Oct 2025 | £974,500 |
| 29 Oct 2010 | £817,500 |
3, Townland Close, Ashford TN27 8AR
| Today | See what it's worth now |
| 26 Sep 2025 | £390,000 |
| 16 Apr 2021 | £315,000 |
No other historical records.
38, Chulkhurst, Ashford TN27 8EF
| Today | See what it's worth now |
| 15 Aug 2025 | £380,000 |
| 2 May 2019 | £295,000 |
2, Glebelands, Biddenden TN27 8EA
| Today | See what it's worth now |
| 1 Jul 2025 | £330,000 |
No other historical records.
Rosewood, Little Randolphs Farm, Tenterden Road, Biddenden TN27 8BG
| Today | See what it's worth now |
| 24 Jun 2025 | £975,000 |
No other historical records.
Magnolia, Sissinghurst Road, Ashford TN27 8EQ
| Today | See what it's worth now |
| 16 Jun 2025 | £610,000 |
| 4 Apr 2008 | £325,000 |
Meadowside, Little Randolphs Farm, Tenterden Road, Biddenden TN27 8BG
| Today | See what it's worth now |
| 11 Jun 2025 | £900,000 |
No other historical records.
25a Little Musings, North Street, Ashford TN27 8AG
| Today | See what it's worth now |
| 20 May 2025 | £435,000 |
| 11 Nov 2016 | £310,000 |
1, North Street, Ashford TN27 8AG
| Today | See what it's worth now |
| 16 May 2025 | £240,000 |
| 28 Mar 2014 | £180,000 |
Ferndale, Little Randolphs Farm, Tenterden Road, Biddenden TN27 8BG
| Today | See what it's worth now |
| 17 Apr 2025 | £1,400,000 |
No other historical records.
28 Hawthorns, Mansion House Close, Ashford TN27 8DE
| Today | See what it's worth now |
| 31 Mar 2025 | £585,000 |
| 15 Apr 2015 | £460,000 |
55, Chulkhurst, Biddenden TN27 8EF
| Today | See what it's worth now |
| 28 Mar 2025 | £320,000 |
No other historical records.
26, The Meadows, Biddenden TN27 8AW
| Today | See what it's worth now |
| 28 Feb 2025 | £268,000 |
No other historical records.
17, The Weavers, Ashford TN27 8AP
| Today | See what it's worth now |
| 17 Feb 2025 | £350,000 |
| 29 May 2015 | £235,000 |
Hornbeams, Tenterden Road, Ashford TN27 8BJ
| Today | See what it's worth now |
| 7 Feb 2025 | £955,000 |
| 3 Jan 1997 | £212,000 |
No other historical records.
70, Headcorn Road, Ashford TN27 8JN
| Today | See what it's worth now |
| 6 Nov 2024 | £400,000 |
| 20 Apr 2007 | £237,500 |
37, North Street, Ashford TN27 8BA


| Today | See what it's worth now |
| 31 Oct 2024 | £810,000 |
| 1 Aug 2006 | £580,000 |
Whitehouse Cottage, Hareplain Road, Ashford TN27 8LN
| Today | See what it's worth now |
| 31 Oct 2024 | £367,500 |
| 6 May 2020 | £285,000 |
Wealden, Cot Lane, Ashford TN27 8JD
| Today | See what it's worth now |
| 16 Oct 2024 | £1,250,000 |
| 15 Sep 2013 | £635,000 |
No other historical records.
2a, Woolpack Corner, Benenden Road, Biddenden TN27 8BU

| Today | See what it's worth now |
| 13 Sep 2024 | £435,000 |
| 13 Sep 2019 | £342,500 |
No other historical records.
14, The Meadows, Biddenden TN27 8AN

| Today | See what it's worth now |
| 30 Aug 2024 | £253,000 |
No other historical records.
Source Acknowledgement: © Crown copyright. England and Wales house price data is publicly available information produced by the HM Land Registry.This material was last updated on 4 February 2026. It covers the period from 1 January 1995 to 24 December 2025 and contains property transactions which have been registered during that period. Contains HM Land Registry data © Crown copyright and database right 2026. This data is licensed under the Open Government Licence v3.0.
Disclaimer: Rightmove.co.uk provides this HM Land Registry data "as is". The burden for fitness of the data relies completely with the user and is provided for informational purposes only. No warranty, express or implied, is given relating to the accuracy of content of the HM Land Registry data and Rightmove does not accept any liability for error or omission. If you have found an error with the data or need further information please contact HM Land Registry.
Permitted Use: Viewers of this Information are granted permission to access this Crown copyright material and to download it onto electronic, magnetic, optical or similar storage media provided that such activities are for private research, study or in-house use only. Any other use of the material requires the formal written permission of Land Registry which can be requested from us, and is subject to an additional licence and associated charge.
Map data ©OpenStreetMap contributors.
Rightmove takes no liability for your use of, or reliance on, Rightmove's Instant Valuation due to the limitations of our tracking tool listed here. Use of this tool is taken entirely at your own risk. All rights reserved.