
House Prices in Blackbrook
House prices in Blackbrook have an overall average of £140,808 over the last year.
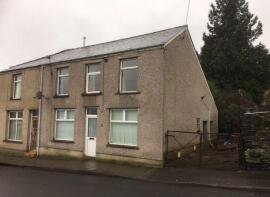
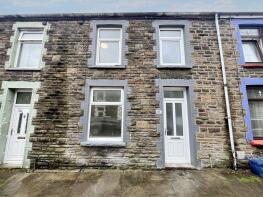
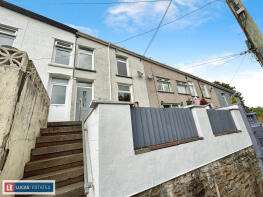
The majority of properties sold in Blackbrook during the last year were terraced properties, selling for an average price of £126,937. Semi-detached properties sold for an average of £160,488, with detached properties fetching £395,000.
Overall, the historical sold prices in Blackbrook over the last year were 26% down on the previous year and 30% down on the 2022 peak of £200,631.
Properties Sold
41, Thornwood Place, Treharris CF46 5AB
| Today | See what it's worth now |
| 27 Mar 2026 | £129,995 |
| 5 Nov 2021 | £112,000 |
7, Sunny Bank, Goitre-coed Road, Treharris CF46 5BA
| Today | See what it's worth now |
| 20 Feb 2026 | £169,000 |
| 26 May 1999 | £27,500 |
No other historical records.
1, Brynteg, Cardiff Road, Treharris CF46 5RF
| Today | See what it's worth now |
| 6 Feb 2026 | £240,000 |
| 16 Jun 2017 | £70,000 |
No other historical records.
20, Pritchard Street, Treharris CF46 5HS
| Today | See what it's worth now |
| 3 Feb 2026 | £105,000 |
No other historical records.
88, Cilhaul, Treharris CF46 5HU
| Today | See what it's worth now |
| 2 Feb 2026 | £122,000 |
| 29 Jun 2018 | £65,000 |
No other historical records.
43, Westwood Drive, Treharris CF46 5BL
| Today | See what it's worth now |
| 29 Jan 2026 | £200,000 |
No other historical records.
18, Pritchard Street, Treharris CF46 5HS
| Today | See what it's worth now |
| 29 Jan 2026 | £120,000 |
| 15 Jan 2010 | £67,500 |
No other historical records.
41, Brynteg, Cardiff Road, Treharris CF46 5RE
| Today | See what it's worth now |
| 29 Jan 2026 | £195,000 |
| 17 Sep 2021 | £185,000 |
No other historical records.
3, Treharne Road, Treharris CF46 5NY
| Today | See what it's worth now |
| 20 Jan 2026 | £165,000 |
No other historical records.
1, White Hart Cottages, Cardiff Road, Quakers Yard, Treharris CF46 5DT

| Today | See what it's worth now |
| 16 Jan 2026 | £62,000 |
| 17 Jan 2003 | £30,000 |
No other historical records.
25, Thornwood Place, Treharris CF46 5AB
| Today | See what it's worth now |
| 9 Jan 2026 | £110,000 |
| 5 Nov 1999 | £32,500 |
No other historical records.
40, Brynteg, Cardiff Road, Treharris CF46 5RE
| Today | See what it's worth now |
| 19 Dec 2025 | £118,000 |
| 30 Aug 2024 | £131,000 |
1, Forest Road, Treharris CF46 5HG
| Today | See what it's worth now |
| 19 Dec 2025 | £120,000 |
| 7 Apr 2017 | £90,000 |
No other historical records.
7, Cardiff Road, Treharris CF46 5EY
| Today | See what it's worth now |
| 19 Dec 2025 | £120,000 |
| 6 Mar 2020 | £69,000 |
No other historical records.
61, Fell Street, Treharris CF46 5HN
| Today | See what it's worth now |
| 4 Dec 2025 | £125,000 |
No other historical records.
10, John Street, Treharris CF46 5PS

| Today | See what it's worth now |
| 28 Nov 2025 | £117,500 |
| 18 May 2009 | £45,000 |
17, Thornwood Place, Treharris CF46 5AB
| Today | See what it's worth now |
| 28 Nov 2025 | £128,000 |
| 26 Feb 2013 | £45,000 |
No other historical records.
38, Thornwood Place, Treharris CF46 5AB
| Today | See what it's worth now |
| 14 Nov 2025 | £153,000 |
| 21 Nov 2022 | £135,000 |
18, Thomas Street, Treharris CF46 5LG
| Today | See what it's worth now |
| 27 Oct 2025 | £150,000 |
| 13 Jan 2023 | £95,000 |
66, Cilhaul, Treharris CF46 5HU
| Today | See what it's worth now |
| 17 Oct 2025 | £95,000 |
No other historical records.
11, Pritchard Street, Treharris CF46 5HS
| Today | See what it's worth now |
| 9 Oct 2025 | £106,000 |
| 2 Jul 2021 | £88,000 |
8, Bryngerwn Cottages, Caerphilly Road, Treharris CF46 5DF
| Today | See what it's worth now |
| 30 Sep 2025 | £140,000 |
No other historical records.
2, White Hart Cottages, Cardiff Road, Quakers Yard, Treharris CF46 5DT
| Today | See what it's worth now |
| 29 Sep 2025 | £83,000 |
| 7 Jan 2021 | £43,000 |

Source Acknowledgement: © Crown copyright. England and Wales house price data is publicly available information produced by the HM Land Registry.This material was last updated on 9 July 2026. It covers the period from 1 January 1995 to 30 April 2026 and contains property transactions which have been registered during that period. Contains HM Land Registry data © Crown copyright and database right 2026. This data is licensed under the Open Government Licence v3.0.
Disclaimer: Rightmove.co.uk provides this HM Land Registry data "as is". The burden for fitness of the data relies completely with the user and is provided for informational purposes only. No warranty, express or implied, is given relating to the accuracy of content of the HM Land Registry data and Rightmove does not accept any liability for error or omission. If you have found an error with the data or need further information please contact HM Land Registry.
Permitted Use: Viewers of this Information are granted permission to access this Crown copyright material and to download it onto electronic, magnetic, optical or similar storage media provided that such activities are for private research, study or in-house use only. Any other use of the material requires the formal written permission of Land Registry which can be requested from us, and is subject to an additional licence and associated charge.
Rightmove takes no liability for your use of, or reliance on, Rightmove's Instant Valuation due to the limitations of our tracking tool listed here. Use of this tool is taken entirely at your own risk. All rights reserved.