
House Prices in Blackdown
House prices in Blackdown have an overall average of £401,737 over the last year.
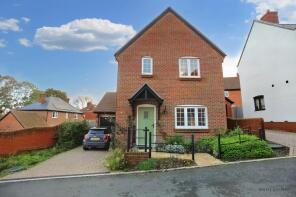
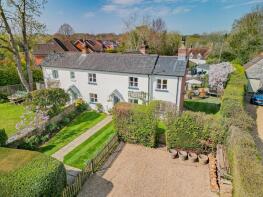
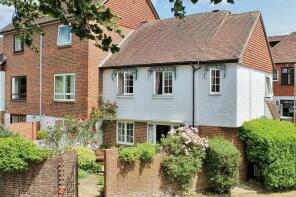
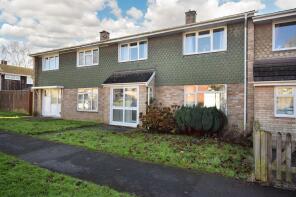
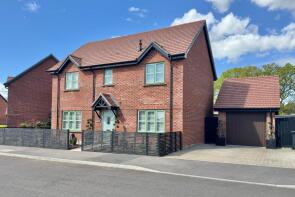
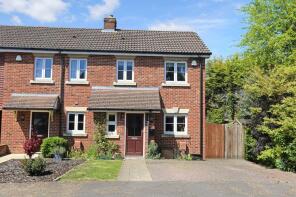
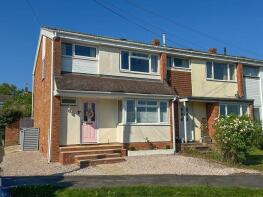
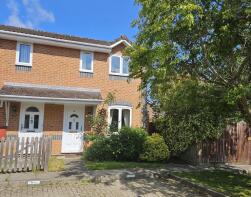
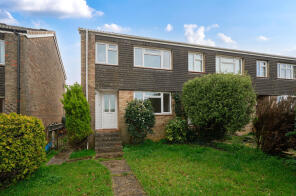
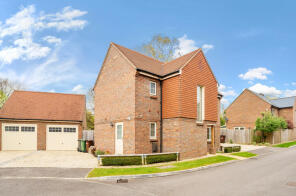
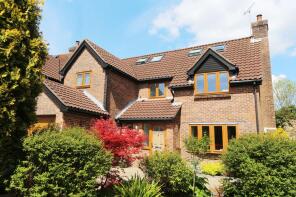
The majority of properties sold in Blackdown during the last year were terraced properties, selling for an average price of £332,778. Semi-detached properties sold for an average of £386,913, with detached properties fetching £597,737.
Overall, the historical sold prices in Blackdown over the last year were 5% down on the previous year and 19% down on the 2023 peak of £496,134.
Properties Sold
24, Bosworth Gardens, Southampton SO32 1QQ

| Today | See what it's worth now |
| 11 Feb 2026 | £420,000 |
| 27 Aug 2021 | £359,950 |
No other historical records.
1, Charles Hemming Drive, Southampton SO32 1QS
| Today | See what it's worth now |
| 9 Feb 2026 | £500,000 |
| 23 Mar 2020 | £410,000 |
Shop House, Upham Street, Southampton SO32 1JA
| Today | See what it's worth now |
| 2 Feb 2026 | £545,000 |
| 31 Oct 2013 | £371,250 |
9, Brook Street, Southampton SO32 1AX
| Today | See what it's worth now |
| 30 Jan 2026 | £440,000 |
| 7 Sep 2018 | £400,000 |
No other historical records.
18, Leopold Drive, Southampton SO32 1JU

| Today | See what it's worth now |
| 23 Jan 2026 | £490,000 |
| 1 Jul 2016 | £328,500 |
No other historical records.
7, Oak Road, Southampton SO32 1EL
| Today | See what it's worth now |
| 7 Jan 2026 | £295,000 |
| 28 Mar 2024 | £250,000 |
No other historical records.
Trurodene, Alma Lane, Upham SO32 1HE


| Today | See what it's worth now |
| 19 Dec 2025 | £500,000 |
No other historical records.
29, Mallard Close, Southampton SO32 1LW
| Today | See what it's worth now |
| 16 Dec 2025 | £315,000 |
| 19 Apr 2016 | £235,000 |
1, Hope Villa, Park Road, Southampton SO32 1BQ
| Today | See what it's worth now |
| 15 Dec 2025 | £475,000 |
| 12 Oct 2018 | £389,000 |
38, Pine Road, Southampton SO32 1EJ
| Today | See what it's worth now |
| 12 Dec 2025 | £370,000 |
| 29 Aug 2014 | £240,000 |
No other historical records.
1, Colehill Gardens, Southampton SO32 1NL
| Today | See what it's worth now |
| 11 Dec 2025 | £325,000 |
| 10 May 2005 | £227,500 |
3, Waltham Road, Southampton SO32 1QZ
| Today | See what it's worth now |
| 11 Dec 2025 | £557,500 |
| 30 Oct 2020 | £555,000 |
No other historical records.
15, Garfield Close, Southampton SO32 1AQ

| Today | See what it's worth now |
| 11 Dec 2025 | £360,000 |
| 20 Aug 1999 | £129,000 |
No other historical records.
8, Pine Lea, Southampton SO32 1NZ
| Today | See what it's worth now |
| 5 Dec 2025 | £362,500 |
| 29 Jan 2021 | £347,500 |
Tillingbourne, Rareridge Lane, Southampton SO32 1DX

| Today | See what it's worth now |
| 4 Dec 2025 | £745,000 |
| 9 Jan 2002 | £359,950 |
1, Cunningham Avenue, Southampton SO32 1DB
| Today | See what it's worth now |
| 1 Dec 2025 | £303,500 |
| 6 Mar 2020 | £260,000 |
26, Cherry Gardens, Southampton SO32 1SE
| Today | See what it's worth now |
| 1 Dec 2025 | £270,000 |
| 21 May 1999 | £71,000 |
No other historical records.
30, Oak Road, Southampton SO32 1EP
| Today | See what it's worth now |
| 25 Nov 2025 | £330,000 |
| 8 Dec 2017 | £263,000 |
6, New Road, Southampton SO32 1FF
| Today | See what it's worth now |
| 21 Nov 2025 | £370,000 |
| 14 Feb 2014 | £250,000 |
No other historical records.
13, St Bonnet Drive, Southampton SO32 1SY

| Today | See what it's worth now |
| 13 Nov 2025 | £285,000 |
| 10 Nov 2017 | £280,000 |
8, Priory Close, Southampton SO32 1AP
| Today | See what it's worth now |
| 30 Oct 2025 | £270,000 |
| 18 Sep 2014 | £226,000 |
3, Palace Mews, Winchester Road, Southampton SO32 1SB
| Today | See what it's worth now |
| 24 Oct 2025 | £357,500 |
| 4 May 2001 | £172,000 |
No other historical records.
41, Ashton Close, Southampton SO32 1FP
| Today | See what it's worth now |
| 24 Oct 2025 | £295,000 |
| 2 Jun 2011 | £195,000 |
2, Grovers Field, Southampton SO32 1QL
| Today | See what it's worth now |
| 23 Oct 2025 | £507,500 |
| 26 Sep 2016 | £410,000 |
No other historical records.
14, Byron Close, Southampton SO32 1RS
| Today | See what it's worth now |
| 16 Oct 2025 | £730,000 |
| 3 Nov 2015 | £495,000 |
Source Acknowledgement: © Crown copyright. England and Wales house price data is publicly available information produced by the HM Land Registry.This material was last updated on 9 April 2026. It covers the period from 1 January 1995 to 27 February 2026 and contains property transactions which have been registered during that period. Contains HM Land Registry data © Crown copyright and database right 2026. This data is licensed under the Open Government Licence v3.0.
Disclaimer: Rightmove.co.uk provides this HM Land Registry data "as is". The burden for fitness of the data relies completely with the user and is provided for informational purposes only. No warranty, express or implied, is given relating to the accuracy of content of the HM Land Registry data and Rightmove does not accept any liability for error or omission. If you have found an error with the data or need further information please contact HM Land Registry.
Permitted Use: Viewers of this Information are granted permission to access this Crown copyright material and to download it onto electronic, magnetic, optical or similar storage media provided that such activities are for private research, study or in-house use only. Any other use of the material requires the formal written permission of Land Registry which can be requested from us, and is subject to an additional licence and associated charge.
Map data ©OpenStreetMap contributors.
Rightmove takes no liability for your use of, or reliance on, Rightmove's Instant Valuation due to the limitations of our tracking tool listed here. Use of this tool is taken entirely at your own risk. All rights reserved.