
House Prices in Eastleigh
House prices in Eastleigh have an overall average of £376,237 over the last year.
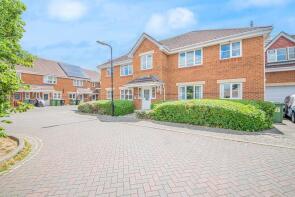
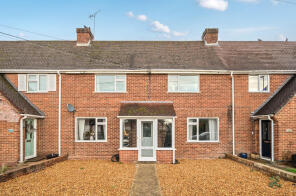
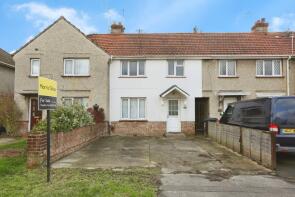
The majority of properties sold in Eastleigh during the last year were detached properties, selling for an average price of £549,672. Terraced properties sold for an average of £300,975, with semi-detached properties fetching £352,861.
Overall, the historical sold prices in Eastleigh over the last year were 2% down on the previous year and similar to the 2023 peak of £379,455.
Properties Sold
18, Archers Road, Eastleigh SO50 9AU
| Today | See what it's worth now |
| 24 Apr 2026 | £310,000 |
| 7 Apr 2004 | £169,950 |
8, Harvest Road, Eastleigh SO53 4HF

| Today | See what it's worth now |
| 23 Apr 2026 | £570,000 |
| 26 Feb 2016 | £399,950 |
87, Bournemouth Road, Eastleigh SO53 3AP
| Today | See what it's worth now |
| 21 Apr 2026 | £260,000 |
| 1 Dec 2023 | £250,000 |
2, Acorn Drive, Eastleigh SO53 1GE
| Today | See what it's worth now |
| 16 Apr 2026 | £322,000 |
| 20 Sep 2013 | £212,000 |
No other historical records.
100 Copperfield, Brownhill Road, Eastleigh SO53 2FL
| Today | See what it's worth now |
| 16 Apr 2026 | £700,000 |
| 15 Mar 2002 | £180,000 |
No other historical records.
140, Hut Farm Place, Eastleigh SO53 3LR
| Today | See what it's worth now |
| 16 Apr 2026 | £175,000 |
| 12 Nov 2018 | £185,000 |
Flat 6, Whitehaugh Court, Church Road, Eastleigh SO50 6DF
| Today | See what it's worth now |
| 16 Apr 2026 | £155,000 |
| 23 Aug 2006 | £138,000 |
No other historical records.
10, Stourvale Gardens, Eastleigh SO53 3NE
| Today | See what it's worth now |
| 16 Apr 2026 | £590,000 |
| 22 Jan 2019 | £432,000 |
No other historical records.
19, Pine Road, Eastleigh SO53 1LQ
| Today | See what it's worth now |
| 16 Apr 2026 | £840,000 |
| 19 Jan 2001 | £235,000 |
No other historical records.
7, Granary Lane, Eastleigh SO50 9QU
| Today | See what it's worth now |
| 15 Apr 2026 | £420,000 |
| 8 Dec 2017 | £337,500 |
No other historical records.
21, Pennington Close, Winchester SO21 1UR
| Today | See what it's worth now |
| 15 Apr 2026 | £315,000 |
| 22 Aug 2003 | £149,950 |
No other historical records.
5, Ormond Close, Eastleigh SO50 8FG
| Today | See what it's worth now |
| 15 Apr 2026 | £292,000 |
| 16 May 2013 | £182,500 |
8, Grays Close, Winchester SO21 1UG

| Today | See what it's worth now |
| 15 Apr 2026 | £471,500 |
| 20 Apr 2017 | £415,000 |
67, Peverells Wood Avenue, Eastleigh SO53 2FX
| Today | See what it's worth now |
| 10 Apr 2026 | £375,000 |
| 26 Feb 2015 | £290,000 |
68 Spring Thyme, Consort Road, Eastleigh SO50 4JB
| Today | See what it's worth now |
| 10 Apr 2026 | £315,000 |
| 13 Sep 2018 | £245,000 |
No other historical records.
5, Saddlers Close, Eastleigh SO50 4SB
| Today | See what it's worth now |
| 10 Apr 2026 | £520,000 |
| 6 May 2011 | £320,500 |
No other historical records.
25, Barn Piece, Eastleigh SO53 4HP
| Today | See what it's worth now |
| 9 Apr 2026 | £355,000 |
| 9 Aug 2005 | £200,000 |
57, Westwood Gardens, Chandler's Ford SO53 1FN
| Today | See what it's worth now |
| 8 Apr 2026 | £485,000 |
No other historical records.
15, George Wright Close, Eastleigh SO50 5SJ
| Today | See what it's worth now |
| 8 Apr 2026 | £198,000 |
| 11 Feb 2015 | £150,000 |
32, Oakmount Road, Eastleigh SO53 2LH
| Today | See what it's worth now |
| 7 Apr 2026 | £355,000 |
| 4 Dec 2009 | £179,950 |
No other historical records.
28, Locksley Road, Eastleigh SO50 5DS
| Today | See what it's worth now |
| 7 Apr 2026 | £300,000 |
| 3 Feb 2016 | £150,000 |
2, Seymour Close, Eastleigh SO53 2JE
| Today | See what it's worth now |
| 7 Apr 2026 | £350,000 |
| 17 Jan 2020 | £230,000 |
54, Hoddinott Road, Eastleigh SO50 5SN
| Today | See what it's worth now |
| 2 Apr 2026 | £200,000 |
| 10 Dec 2021 | £197,000 |


Source Acknowledgement: © Crown copyright. England and Wales house price data is publicly available information produced by the HM Land Registry.This material was last updated on 9 July 2026. It covers the period from 1 January 1995 to 30 April 2026 and contains property transactions which have been registered during that period. Contains HM Land Registry data © Crown copyright and database right 2026. This data is licensed under the Open Government Licence v3.0.
Disclaimer: Rightmove.co.uk provides this HM Land Registry data "as is". The burden for fitness of the data relies completely with the user and is provided for informational purposes only. No warranty, express or implied, is given relating to the accuracy of content of the HM Land Registry data and Rightmove does not accept any liability for error or omission. If you have found an error with the data or need further information please contact HM Land Registry.
Permitted Use: Viewers of this Information are granted permission to access this Crown copyright material and to download it onto electronic, magnetic, optical or similar storage media provided that such activities are for private research, study or in-house use only. Any other use of the material requires the formal written permission of Land Registry which can be requested from us, and is subject to an additional licence and associated charge.
Rightmove takes no liability for your use of, or reliance on, Rightmove's Instant Valuation due to the limitations of our tracking tool listed here. Use of this tool is taken entirely at your own risk. All rights reserved.