
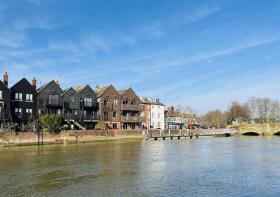
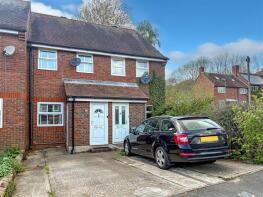
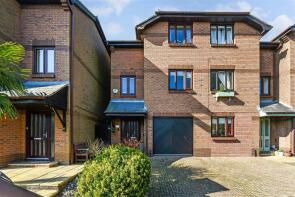
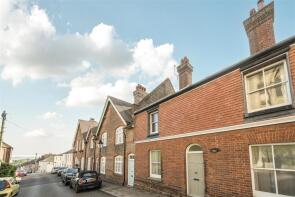
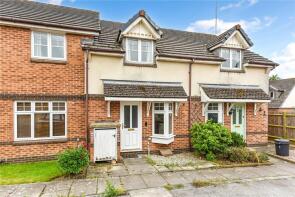
House Prices in Blakehurst
House prices in Blakehurst have an overall average of £649,100 over the last year.
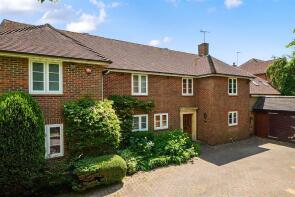
The majority of properties sold in Blakehurst during the last year were terraced properties, selling for an average price of £602,767. Detached properties sold for an average of £989,462, with semi-detached properties fetching £420,071.
Overall, the historical sold prices in Blakehurst over the last year were 28% up on the previous year and 15% up on the 2022 peak of £564,805.
Properties Sold
40, Pearson Road, Arundel BN18 9HR
| Today | See what it's worth now |
| 12 Mar 2026 | £360,000 |
| 30 Oct 2009 | £235,000 |
4 The Chantry, Tower House Gardens, Arundel BN18 9RU
| Today | See what it's worth now |
| 2 Mar 2026 | £947,000 |
| 15 May 2017 | £840,000 |
33, Wood View, Arundel BN18 9ED

| Today | See what it's worth now |
| 2 Mar 2026 | £358,000 |
No other historical records.
11, Wood View, Arundel BN18 9ED
| Today | See what it's worth now |
| 20 Feb 2026 | £430,000 |
| 10 Mar 2021 | £420,000 |
5, Flint Cottages, Mount Pleasant, Arundel BN18 9BD
| Today | See what it's worth now |
| 10 Feb 2026 | £875,000 |
| 17 Jun 2022 | £800,000 |
1, Town Quay, River Road, Arundel BN18 9DF
| Today | See what it's worth now |
| 6 Feb 2026 | £470,000 |
| 4 Nov 2020 | £450,000 |
Smoke Tree Cottage, East Street, Arundel BN18 9NN
| Today | See what it's worth now |
| 4 Feb 2026 | £1,350,000 |
| 9 Dec 2015 | £530,000 |
Slate Cottage, Poling Street, Arundel BN18 9PS

| Today | See what it's worth now |
| 23 Jan 2026 | £640,000 |
| 24 Aug 2015 | £580,000 |
219, Warningcamp Lane, Warningcamp BN18 9QX
| Today | See what it's worth now |
| 16 Jan 2026 | £660,000 |
No other historical records.
Flat 9, Caen Stone Court, Queen Street, Arundel BN18 9FE

| Today | See what it's worth now |
| 15 Jan 2026 | £108,000 |
| 22 Dec 2011 | £173,500 |
No other historical records.
3, Arun Street, Arundel BN18 9DL
| Today | See what it's worth now |
| 16 Dec 2025 | £350,000 |
| 24 Jul 2020 | £485,500 |
Malthouse Cottage, Brewery Hill, Arundel BN18 9DQ
| Today | See what it's worth now |
| 10 Dec 2025 | £725,000 |
| 17 Apr 2025 | £500,000 |
24, King Street, Arundel BN18 9BW
| Today | See what it's worth now |
| 5 Dec 2025 | £500,000 |
| 5 Jul 1996 | £71,000 |
No other historical records.
2, Sportsmans Cottages, Rackham Road, Arundel BN18 9NR

| Today | See what it's worth now |
| 24 Nov 2025 | £635,000 |
| 1 Jul 1999 | £131,050 |
No other historical records.
10, Stewards Rise, Arundel BN18 9ER
| Today | See what it's worth now |
| 13 Nov 2025 | £410,000 |
| 4 May 2000 | £120,000 |
No other historical records.
Flat 7, Causeway Court, Queen Street, Arundel BN18 9LE
| Today | See what it's worth now |
| 13 Nov 2025 | £100,000 |
| 13 Nov 2020 | £120,000 |
4, Ellis Close, Arundel BN18 9LG
| Today | See what it's worth now |
| 13 Nov 2025 | £255,000 |
| 14 Dec 2017 | £220,000 |
7, Penfolds Place, Arundel BN18 9SA
| Today | See what it's worth now |
| 11 Nov 2025 | £450,000 |
| 22 Mar 2022 | £475,000 |
53, King Street, Arundel BN18 9BN
| Today | See what it's worth now |
| 24 Oct 2025 | £692,000 |
No other historical records.
Lees Orchard, East Street, Arundel BN18 9NN
| Today | See what it's worth now |
| 22 Oct 2025 | £950,000 |
| 10 Dec 2020 | £1,100,000 |
No other historical records.
39, Penfolds Place, Arundel BN18 9SA
| Today | See what it's worth now |
| 10 Oct 2025 | £282,500 |
| 27 Jan 1999 | £83,000 |
23, Priory Road, Arundel BN18 9ET

| Today | See what it's worth now |
| 26 Sep 2025 | £395,000 |
No other historical records.
31, Torton Hill Road, Arundel BN18 9HF
| Today | See what it's worth now |
| 11 Sep 2025 | £1,250,000 |
| 22 Jun 2005 | £520,000 |
9, Tarrant Wharf, Arundel BN18 9NY
| Today | See what it's worth now |
| 18 Aug 2025 | £570,000 |
| 17 Sep 2013 | £420,000 |
27, Nineveh Shipyard, Arundel BN18 9SU
| Today | See what it's worth now |
| 11 Aug 2025 | £605,000 |
No other historical records.
Source Acknowledgement: © Crown copyright. England and Wales house price data is publicly available information produced by the HM Land Registry.This material was last updated on 15 May 2026. It covers the period from 1 January 1995 to 31 March 2026 and contains property transactions which have been registered during that period. Contains HM Land Registry data © Crown copyright and database right 2026. This data is licensed under the Open Government Licence v3.0.
Disclaimer: Rightmove.co.uk provides this HM Land Registry data "as is". The burden for fitness of the data relies completely with the user and is provided for informational purposes only. No warranty, express or implied, is given relating to the accuracy of content of the HM Land Registry data and Rightmove does not accept any liability for error or omission. If you have found an error with the data or need further information please contact HM Land Registry.
Permitted Use: Viewers of this Information are granted permission to access this Crown copyright material and to download it onto electronic, magnetic, optical or similar storage media provided that such activities are for private research, study or in-house use only. Any other use of the material requires the formal written permission of Land Registry which can be requested from us, and is subject to an additional licence and associated charge.
Map data ©OpenStreetMap contributors.
Rightmove takes no liability for your use of, or reliance on, Rightmove's Instant Valuation due to the limitations of our tracking tool listed here. Use of this tool is taken entirely at your own risk. All rights reserved.