
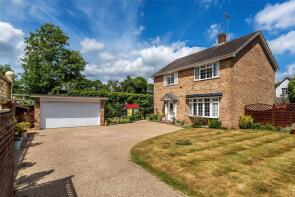
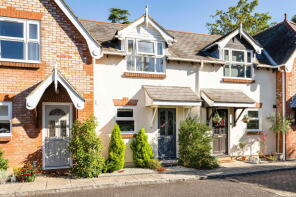
House Prices in Bookham
House prices in Bookham have an overall average of £761,866 over the last year.
The majority of properties sold in Bookham during the last year were detached properties, selling for an average price of £907,880. Semi-detached properties sold for an average of £581,370, with terraced properties fetching £468,161.
Overall, the historical sold prices in Bookham over the last year were 4% down on the previous year and 2% up on the 2023 peak of £748,756.
Properties Sold
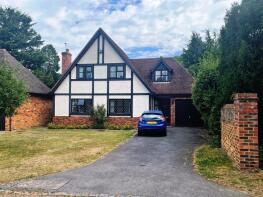
78, Eastwick Park Avenue, Leatherhead KT23 3NP

| Today | See what it's worth now |
| 2 Apr 2026 | £876,000 |
| 12 Mar 2020 | £652,500 |
No other historical records.
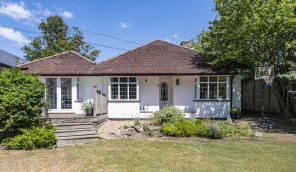
7, Camilla Close, Great Bookham KT23 4BU
| Today | See what it's worth now |
| 27 Mar 2026 | £806,000 |
No other historical records.
40, Howard Road, Leatherhead KT23 4PW
| Today | See what it's worth now |
| 24 Mar 2026 | £845,000 |
| 28 Jul 2016 | £760,000 |
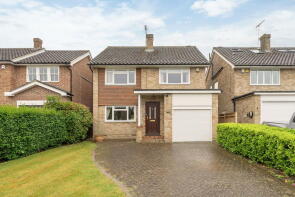
57, Middlemead Road, Leatherhead KT23 3DB
| Today | See what it's worth now |
| 20 Mar 2026 | £463,000 |
| 23 Aug 2019 | £390,000 |
Flat 2, Park Corner, The Park, Leatherhead KT23 3JL
| Today | See what it's worth now |
| 19 Mar 2026 | £420,000 |
| 27 Mar 2017 | £485,000 |
No other historical records.
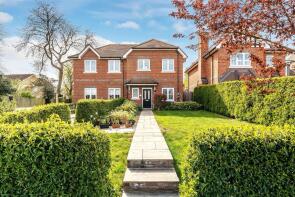
12, Bookham Grove, Leatherhead KT23 4NS
| Today | See what it's worth now |
| 19 Mar 2026 | £422,500 |
| 21 Nov 2019 | £380,000 |
59, Norwood Road, Effingham KT24 5NU
| Today | See what it's worth now |
| 13 Mar 2026 | £560,000 |
No other historical records.
9, Groveside Close, Leatherhead KT23 4LQ

| Today | See what it's worth now |
| 11 Mar 2026 | £1,072,500 |
| 29 Sep 2006 | £725,000 |
No other historical records.
11, Kennel Lane, Fetcham KT22 9PQ
| Today | See what it's worth now |
| 27 Feb 2026 | £650,000 |
No other historical records.
26, Norwood Road, Leatherhead KT24 5NT
| Today | See what it's worth now |
| 26 Feb 2026 | £495,000 |
| 28 May 2021 | £510,000 |
No other historical records.
2, The Oaks, Leatherhead KT22 9PP

| Today | See what it's worth now |
| 26 Feb 2026 | £899,950 |
| 19 Jun 2014 | £675,000 |
42, Oveton Way, Great Bookham KT23 4ND
| Today | See what it's worth now |
| 23 Feb 2026 | £450,000 |
No other historical records.
56, Norwood Road, Leatherhead KT24 5NX

| Today | See what it's worth now |
| 19 Feb 2026 | £625,000 |
| 30 Apr 2010 | £369,000 |
106, Middlemead Road, Leatherhead KT23 3DD

| Today | See what it's worth now |
| 9 Feb 2026 | £540,000 |
| 5 Apr 2019 | £462,500 |
36, Woodlands Road, Leatherhead KT23 4HF
| Today | See what it's worth now |
| 9 Feb 2026 | £845,000 |
| 6 May 2011 | £570,000 |
No other historical records.
14, South End, Leatherhead KT23 4SQ

| Today | See what it's worth now |
| 22 Jan 2026 | £425,000 |
| 29 May 1996 | £81,000 |
No other historical records.
2, Parklands, Leatherhead KT23 3NB
| Today | See what it's worth now |
| 22 Jan 2026 | £800,000 |
| 29 May 1998 | £252,500 |
No other historical records.
Mayella, Mount Pleasant, Leatherhead KT24 5NS
| Today | See what it's worth now |
| 19 Jan 2026 | £695,000 |
| 6 Dec 1996 | £117,500 |
No other historical records.
21, The Spinney, Great Bookham KT23 3PZ
| Today | See what it's worth now |
| 15 Jan 2026 | £725,000 |
No other historical records.
1, Lyfield Court, Leatherhead KT23 3BG
| Today | See what it's worth now |
| 14 Jan 2026 | £690,000 |
| 24 Oct 2016 | £575,000 |
No other historical records.
35, The Lorne, Leatherhead KT23 4JY
| Today | See what it's worth now |
| 7 Jan 2026 | £850,000 |
| 26 Jul 1999 | £215,000 |
No other historical records.
4, The Green, Leatherhead KT22 9XE
| Today | See what it's worth now |
| 6 Jan 2026 | £720,000 |
| 9 Sep 2016 | £610,000 |
No other historical records.
37, Strathcona Avenue, Leatherhead KT23 4HW
| Today | See what it's worth now |
| 19 Dec 2025 | £525,000 |
| 8 Jun 2018 | £477,500 |
No other historical records.
Source Acknowledgement: © Crown copyright. England and Wales house price data is publicly available information produced by the HM Land Registry.This material was last updated on 9 July 2026. It covers the period from 1 January 1995 to 30 April 2026 and contains property transactions which have been registered during that period. Contains HM Land Registry data © Crown copyright and database right 2026. This data is licensed under the Open Government Licence v3.0.
Disclaimer: Rightmove.co.uk provides this HM Land Registry data "as is". The burden for fitness of the data relies completely with the user and is provided for informational purposes only. No warranty, express or implied, is given relating to the accuracy of content of the HM Land Registry data and Rightmove does not accept any liability for error or omission. If you have found an error with the data or need further information please contact HM Land Registry.
Permitted Use: Viewers of this Information are granted permission to access this Crown copyright material and to download it onto electronic, magnetic, optical or similar storage media provided that such activities are for private research, study or in-house use only. Any other use of the material requires the formal written permission of Land Registry which can be requested from us, and is subject to an additional licence and associated charge.
Rightmove takes no liability for your use of, or reliance on, Rightmove's Instant Valuation due to the limitations of our tracking tool listed here. Use of this tool is taken entirely at your own risk. All rights reserved.