
House Prices in Boveney
House prices in Boveney have an overall average of £478,227 over the last year.
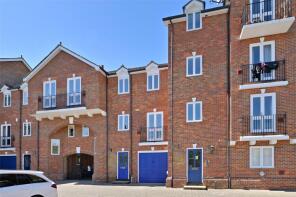
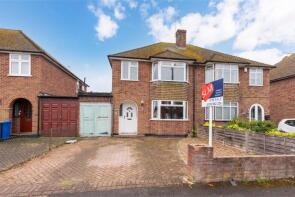
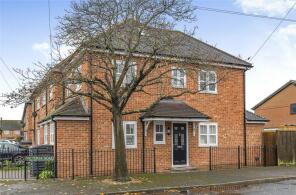
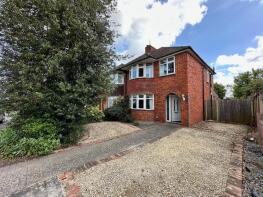
The majority of properties sold in Boveney during the last year were detached properties, selling for an average price of £579,450. Semi-detached properties sold for an average of £524,750, with flats fetching £285,643.
Overall, the historical sold prices in Boveney over the last year were 4% down on the previous year and 15% down on the 2023 peak of £559,871.
Properties Sold
Flat 23, Atherton Court, Meadow Lane, Eton, Windsor SL4 6BN
| Today | See what it's worth now |
| 12 Mar 2026 | £325,000 |
| 20 Dec 2000 | £140,000 |
111a, Colenorton Crescent, Eton Wick, Windsor SL4 6LD

| Today | See what it's worth now |
| 18 Feb 2026 | £560,000 |
| 24 Apr 2017 | £430,000 |
No other historical records.
12, King Stable Street, Eton, Windsor SL4 6AB
| Today | See what it's worth now |
| 16 Feb 2026 | £805,000 |
| 12 Jan 1996 | £199,750 |
No other historical records.
19, Common Road, Eton Wick, Windsor SL4 6JE
| Today | See what it's worth now |
| 12 Feb 2026 | £185,000 |
| 8 Sep 1997 | £55,250 |
No other historical records.
7, Stonebridge Field, Eton, Windsor SL4 6PS
| Today | See what it's worth now |
| 30 Jan 2026 | £533,000 |
| 26 Feb 2004 | £250,000 |
No other historical records.
32, Queens Road, Eton Wick, Windsor SL4 6NA
| Today | See what it's worth now |
| 29 Jan 2026 | £575,000 |
| 29 May 1998 | £127,000 |
No other historical records.
38, Tilstone Close, Eton Wick, Windsor SL4 6NG
| Today | See what it's worth now |
| 12 Jan 2026 | £730,000 |
| 24 Aug 2023 | £640,000 |
No other historical records.
Farm House, Crown Farm, Eton Wick Road, Eton Wick, Windsor SL4 6PG
| Today | See what it's worth now |
| 10 Dec 2025 | £915,000 |
No other historical records.
9, Stonebridge Field, Eton, Windsor SL4 6PS
| Today | See what it's worth now |
| 9 Dec 2025 | £416,500 |
| 31 Mar 2008 | £315,000 |
2a, Princes Close, Eton Wick, Windsor SL4 6LZ
| Today | See what it's worth now |
| 8 Dec 2025 | £465,000 |
| 23 Jun 2023 | £455,000 |
16, Victoria Road, Eton Wick, Windsor SL4 6LY

| Today | See what it's worth now |
| 4 Dec 2025 | £360,000 |
| 11 Aug 2009 | £175,000 |
No other historical records.
29, Tilstone Avenue, Eton Wick, Windsor SL4 6NF
| Today | See what it's worth now |
| 21 Nov 2025 | £540,000 |
| 2 Mar 1998 | £137,500 |
No other historical records.
18, Boveney New Road, Eton Wick, Windsor SL4 6NH
| Today | See what it's worth now |
| 21 Nov 2025 | £495,000 |
| 1 Feb 2019 | £380,000 |
No other historical records.
11a, Tilstone Close, Eton Wick, Windsor SL4 6NG
| Today | See what it's worth now |
| 14 Nov 2025 | £635,000 |
| 30 Sep 2020 | £525,000 |
No other historical records.
47a, Queens Road, Eton Wick, Windsor SL4 6NA

| Today | See what it's worth now |
| 10 Oct 2025 | £450,000 |
| 20 Oct 2022 | £450,450 |
No other historical records.
65, Eton Wick Road, Eton Wick, Windsor SL4 6NE
| Today | See what it's worth now |
| 26 Sep 2025 | £550,000 |
No other historical records.
33, College Avenue, Slough SL1 2NB
| Today | See what it's worth now |
| 26 Sep 2025 | £475,000 |
No other historical records.
29, Bunces Close, Eton Wick, Windsor SL4 6PL
| Today | See what it's worth now |
| 26 Sep 2025 | £465,000 |
| 24 Jan 2003 | £193,000 |
40, Eton Wick Road, Eton Wick, Windsor SL4 6JL
| Today | See what it's worth now |
| 22 Sep 2025 | £337,000 |
No other historical records.
72, Eton Wick Road, Eton Wick, Windsor SL4 6JL

| Today | See what it's worth now |
| 12 Sep 2025 | £410,000 |
| 13 Dec 2018 | £372,500 |
64, Eton Wick Road, Eton Wick, Windsor SL4 6JL
| Today | See what it's worth now |
| 12 Sep 2025 | £482,000 |
| 23 Aug 2018 | £398,000 |
45, Tilstone Close, Eton Wick, Windsor SL4 6NG
| Today | See what it's worth now |
| 5 Sep 2025 | £465,000 |
No other historical records.
2, Broken Furlong, Eton, Windsor SL4 6PD
| Today | See what it's worth now |
| 29 Aug 2025 | £670,000 |
| 20 Dec 2007 | £239,950 |
Source Acknowledgement: © Crown copyright. England and Wales house price data is publicly available information produced by the HM Land Registry.This material was last updated on 15 May 2026. It covers the period from 1 January 1995 to 31 March 2026 and contains property transactions which have been registered during that period. Contains HM Land Registry data © Crown copyright and database right 2026. This data is licensed under the Open Government Licence v3.0.
Disclaimer: Rightmove.co.uk provides this HM Land Registry data "as is". The burden for fitness of the data relies completely with the user and is provided for informational purposes only. No warranty, express or implied, is given relating to the accuracy of content of the HM Land Registry data and Rightmove does not accept any liability for error or omission. If you have found an error with the data or need further information please contact HM Land Registry.
Permitted Use: Viewers of this Information are granted permission to access this Crown copyright material and to download it onto electronic, magnetic, optical or similar storage media provided that such activities are for private research, study or in-house use only. Any other use of the material requires the formal written permission of Land Registry which can be requested from us, and is subject to an additional licence and associated charge.
Rightmove takes no liability for your use of, or reliance on, Rightmove's Instant Valuation due to the limitations of our tracking tool listed here. Use of this tool is taken entirely at your own risk. All rights reserved.