
House Prices in Bradford-On-Avon
House prices in Bradford-On-Avon have an overall average of £410,911 over the last year.
The majority of properties sold in Bradford-On-Avon during the last year were terraced properties, selling for an average price of £424,058. Detached properties sold for an average of £553,945, with semi-detached properties fetching £398,598.
Overall, the historical sold prices in Bradford-On-Avon over the last year were 10% down on the previous year and 15% down on the 2022 peak of £480,956.
Properties Sold
31, Springfield, Bradford-on-avon BA15 1BA

| Today | See today's value |
| 19 Aug 2026 | £260,000 |
| 7 Mar 2025 | £252,000 |
Flat 4, 13 Silver Street House, Silver Street, Bradford-on-avon BA15 1JY
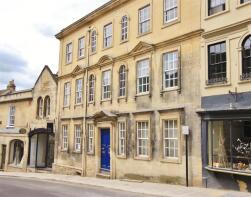
| Today | See today's value |
| 18 Aug 2026 | £218,000 |
| 15 Nov 2019 | £192,000 |
15, Market Street, Bradford-on-avon BA15 1LL

| Today | See today's value |
| 12 Aug 2026 | £242,000 |
| 3 May 2013 | £147,000 |
29, Budbury Tyning, Bradford-on-avon BA15 1QE
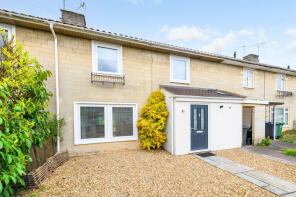
| Today | See today's value |
| 7 Aug 2026 | £329,250 |
| 20 Sep 2019 | £230,000 |
No other historical records.
24, Kingsfield, Bradford-on-avon BA15 1AN

| Today | See today's value |
| 7 Aug 2026 | £95,000 |
| 8 Jan 2016 | £199,950 |
No other historical records.
17, Huntingdon Street, Bradford-on-avon BA15 1RF
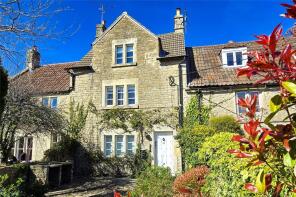
| Today | See today's value |
| 5 Aug 2026 | £407,500 |
| 22 Dec 2008 | £175,000 |
No other historical records.
28, The Old Batch, Bradford-on-avon BA15 1TL
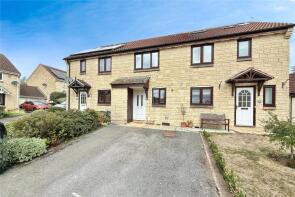
| Today | See today's value |
| 4 Aug 2026 | £282,000 |
| 17 Dec 2010 | £175,000 |
2b, Bearfield Buildings, Bradford-on-avon BA15 1RP
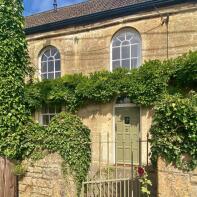
| Today | See today's value |
| 24 Jul 2026 | £375,000 |
| 10 Feb 2016 | £265,000 |
4, The Maltings, Bradford-on-avon BA15 2EP
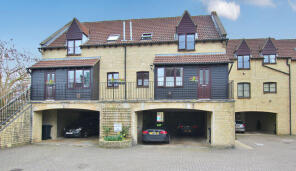
| Today | See today's value |
| 24 Jul 2026 | £183,500 |
| 29 Jun 2007 | £142,500 |
No other historical records.
17, Leigh Park Road, Bradford On Avon BA15 1TE
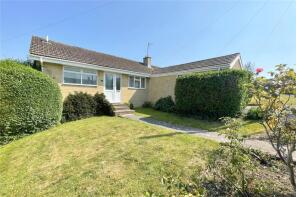
| Today | See today's value |
| 17 Jul 2026 | £390,000 |
No other historical records.
41, Whitehill, Bradford-on-avon BA15 1SQ
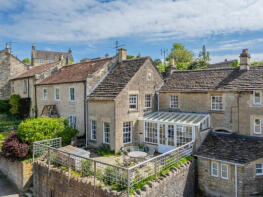
| Today | See today's value |
| 14 Jul 2026 | £550,000 |
| 15 Sep 2023 | £455,000 |
No other historical records.
32, Avon Close, Bradford-on-avon BA15 1JJ
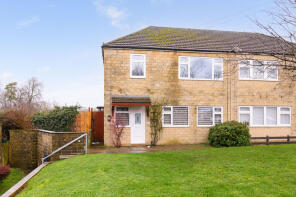
| Today | See today's value |
| 14 Jul 2026 | £320,000 |
| 16 Dec 2011 | £120,000 |
8b, Budbury Tyning, Bradford-on-avon BA15 1QE
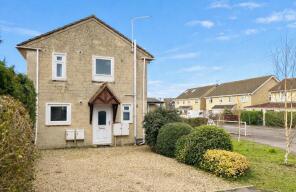
| Today | See today's value |
| 13 Jul 2026 | £179,000 |
| 9 Oct 2007 | £125,000 |
No other historical records.
25, Kingsfield, Bradford On Avon BA15 1AN
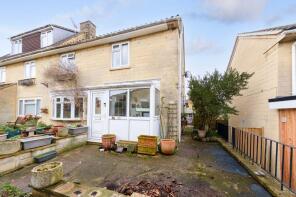
| Today | See today's value |
| 13 Jul 2026 | £282,500 |
No other historical records.
15, Trowbridge Road, Bradford-on-avon BA15 1EE
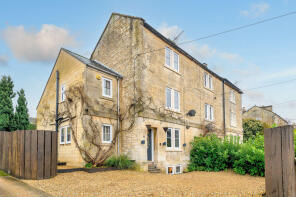
| Today | See today's value |
| 10 Jul 2026 | £677,000 |
| 19 Nov 2020 | £540,750 |
40, Priory Close, Bradford On Avon BA15 1QZ
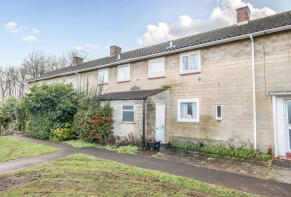
| Today | See today's value |
| 1 Jul 2026 | £252,500 |
No other historical records.
54, Spencers Orchard, Bradford-on-avon BA15 1TJ
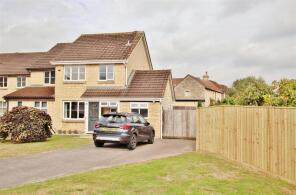
| Today | See today's value |
| 30 Jun 2026 | £547,250 |
| 25 Apr 2023 | £525,000 |
12a, The Ropewalk, Newtown, Bradford-on-avon BA15 1LQ
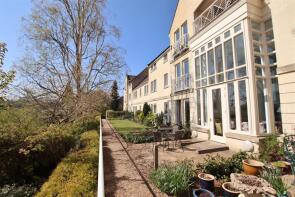
| Today | See today's value |
| 30 Jun 2026 | £206,000 |
| 7 Apr 2022 | £200,000 |
17, Kingsfield Leaze, Bradford-on-avon BA15 1GH

| Today | See today's value |
| 30 Jun 2026 | £440,000 |
| 27 Nov 2020 | £419,995 |
No other historical records.
41, Palairet Close, Bradford-on-avon BA15 1UT
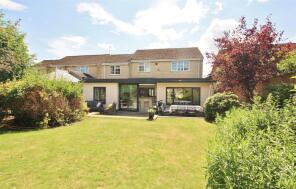
| Today | See today's value |
| 26 Jun 2026 | £690,000 |
| 16 Dec 2011 | £323,000 |
8, St Aldhelm Road, Bradford-on-avon BA15 1HN

| Today | See today's value |
| 26 Jun 2026 | £350,000 |
| 30 Aug 2024 | £334,500 |
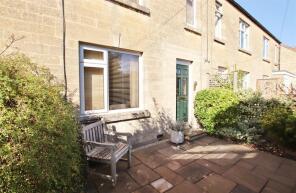
196, Winsley Road, Bradford On Avon BA15 1NU
| Today | See today's value |
| 25 Jun 2026 | £375,000 |
No other historical records.
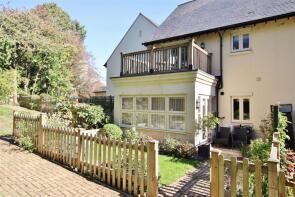
12, Cottle Avenue, Bradford-on-avon BA15 1FD
| Today | See today's value |
| 24 Jun 2026 | £375,000 |
| 21 Nov 2014 | £365,000 |
No other historical records.


Rightmove takes no liability for your use of, or reliance on, Rightmove's Instant Valuation due to the limitations of our tracking tool listed here. Use of this tool is taken entirely at your own risk. All rights reserved.