
House Prices in Bradwell
House prices in Bradwell have an overall average of £269,954 over the last year.
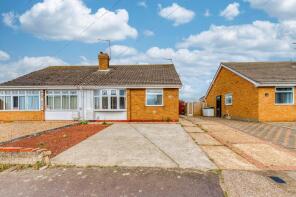
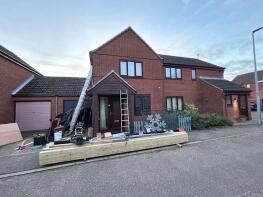
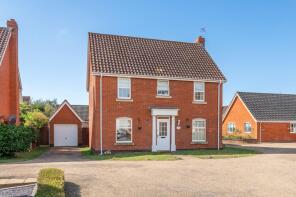
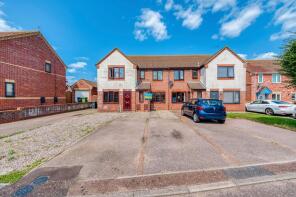
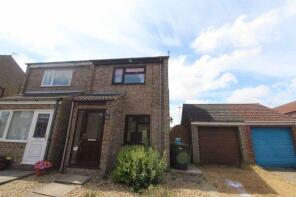
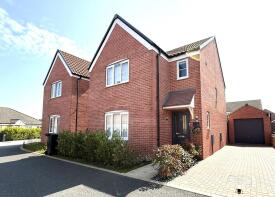
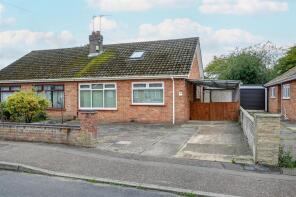
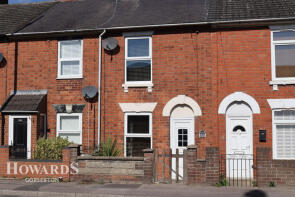
The majority of properties sold in Bradwell during the last year were detached properties, selling for an average price of £327,424. Semi-detached properties sold for an average of £232,825, with terraced properties fetching £216,354.
Overall, the historical sold prices in Bradwell over the last year were 3% down on the previous year and 3% down on the 2022 peak of £277,045.
Properties Sold
97, Blackbird Close, Great Yarmouth NR31 8RT
| Today | See what it's worth now |
| 23 Apr 2026 | £190,000 |
| 29 Mar 2018 | £176,000 |
No other historical records.
5, Siskin Close, Great Yarmouth NR31 8JZ

| Today | See what it's worth now |
| 16 Apr 2026 | £320,000 |
| 8 Nov 2004 | £147,500 |
2, Horsley Drive, Gorleston, Great Yarmouth NR31 7RD

| Today | See what it's worth now |
| 15 Apr 2026 | £272,500 |
| 21 Oct 2005 | £161,495 |
No other historical records.
32, Burnet Road, Great Yarmouth NR31 8SL
| Today | See what it's worth now |
| 10 Apr 2026 | £245,000 |
| 16 Jun 2006 | £138,500 |
2, Cook Close, Great Yarmouth NR31 9GQ
| Today | See what it's worth now |
| 1 Apr 2026 | £325,000 |
| 19 Dec 2022 | £315,000 |
No other historical records.
33, Yew Tree Close, Great Yarmouth NR31 8NZ
| Today | See what it's worth now |
| 23 Mar 2026 | £290,000 |
| 4 May 2004 | £171,500 |
18, Willow Avenue, Great Yarmouth NR31 8HY
| Today | See what it's worth now |
| 20 Mar 2026 | £191,500 |
| 29 Jan 1999 | £45,995 |
No other historical records.
2, Germander Court, Great Yarmouth NR31 8SN
| Today | See what it's worth now |
| 13 Mar 2026 | £210,000 |
| 28 Mar 2002 | £74,000 |
12, Barnard Close, Gorleston, Great Yarmouth NR31 7RN
| Today | See what it's worth now |
| 9 Mar 2026 | £300,000 |
| 30 Oct 2015 | £225,000 |
108, El Alamein Way, Great Yarmouth NR31 8SY
| Today | See what it's worth now |
| 4 Mar 2026 | £155,000 |
| 17 Jul 2019 | £152,000 |
9, Laurel Drive, Great Yarmouth NR31 8PB

| Today | See what it's worth now |
| 3 Mar 2026 | £235,000 |
| 24 Mar 2021 | £205,000 |
5, El Alamein Way, Bradwell NR31 8SX
| Today | See what it's worth now |
| 27 Feb 2026 | £430,950 |
No other historical records.
Holly House, Mill Lane, Bradwell NR31 8HR
| Today | See what it's worth now |
| 27 Feb 2026 | £475,000 |
| 7 Jan 2016 | £355,000 |
No other historical records.
69, Homefield Avenue, Bradwell NR31 8NW
| Today | See what it's worth now |
| 27 Feb 2026 | £232,500 |
No other historical records.
16, Linden Tree Gardens, Great Yarmouth NR31 8NQ
| Today | See what it's worth now |
| 27 Feb 2026 | £325,000 |
| 1 Apr 2021 | £282,500 |
2, Styles Close, Great Yarmouth NR31 8RJ
| Today | See what it's worth now |
| 25 Feb 2026 | £220,000 |
| 30 Nov 2018 | £140,000 |
3, Darnell Close, Great Yarmouth NR31 9FS
| Today | See what it's worth now |
| 24 Feb 2026 | £295,000 |
| 24 Aug 2021 | £247,500 |
19, Homefield Avenue, Bradwell NR31 8NA
| Today | See what it's worth now |
| 23 Feb 2026 | £210,000 |
No other historical records.
184, Beccles Road, Great Yarmouth NR31 8QD
| Today | See what it's worth now |
| 13 Feb 2026 | £165,000 |
| 27 Sep 2024 | £155,000 |
14, Breeze Close, Great Yarmouth NR31 9XT
| Today | See what it's worth now |
| 13 Feb 2026 | £262,500 |
| 8 Dec 2020 | £219,000 |
No other historical records.
35, Paget Crescent, Gorleston, Great Yarmouth NR31 7RP
| Today | See what it's worth now |
| 12 Feb 2026 | £280,000 |
| 20 Nov 2007 | £200,000 |
31, Salk Road, Gorleston, Great Yarmouth NR31 7RL
| Today | See what it's worth now |
| 12 Feb 2026 | £274,000 |
| 30 Nov 2017 | £190,000 |
15, Chestnut Avenue, Great Yarmouth NR31 8PL
| Today | See what it's worth now |
| 10 Feb 2026 | £212,000 |
| 5 Feb 2014 | £112,500 |
No other historical records.
Source Acknowledgement: © Crown copyright. England and Wales house price data is publicly available information produced by the HM Land Registry.This material was last updated on 9 July 2026. It covers the period from 1 January 1995 to 30 April 2026 and contains property transactions which have been registered during that period. Contains HM Land Registry data © Crown copyright and database right 2026. This data is licensed under the Open Government Licence v3.0.
Disclaimer: Rightmove.co.uk provides this HM Land Registry data "as is". The burden for fitness of the data relies completely with the user and is provided for informational purposes only. No warranty, express or implied, is given relating to the accuracy of content of the HM Land Registry data and Rightmove does not accept any liability for error or omission. If you have found an error with the data or need further information please contact HM Land Registry.
Permitted Use: Viewers of this Information are granted permission to access this Crown copyright material and to download it onto electronic, magnetic, optical or similar storage media provided that such activities are for private research, study or in-house use only. Any other use of the material requires the formal written permission of Land Registry which can be requested from us, and is subject to an additional licence and associated charge.
Rightmove takes no liability for your use of, or reliance on, Rightmove's Instant Valuation due to the limitations of our tracking tool listed here. Use of this tool is taken entirely at your own risk. All rights reserved.