
House Prices in Broadwater Down
House prices in Broadwater Down have an overall average of £666,507 over the last year.
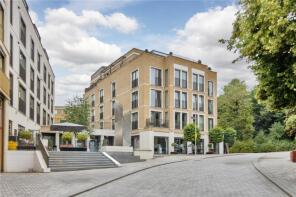
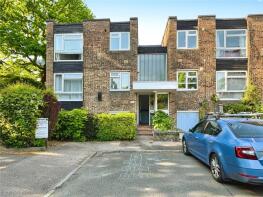
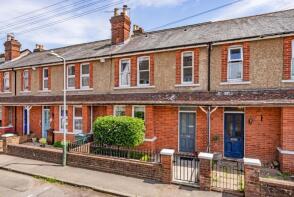
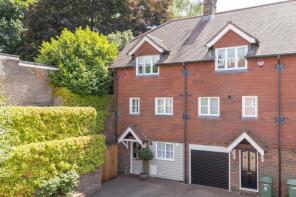
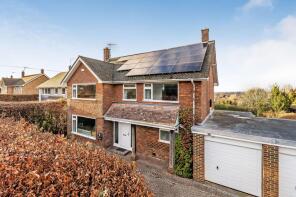
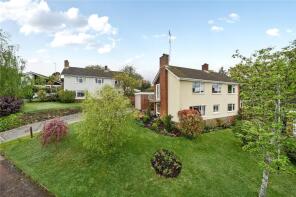
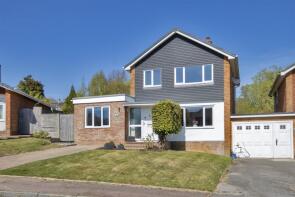
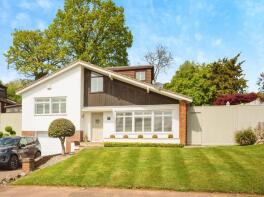
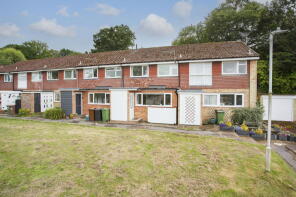
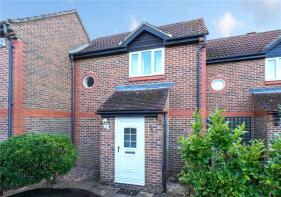
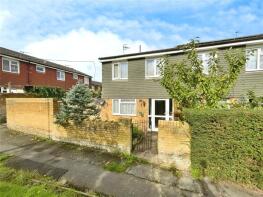
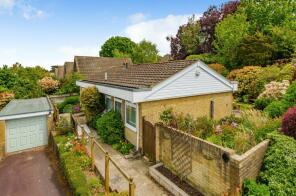
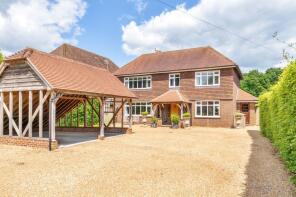
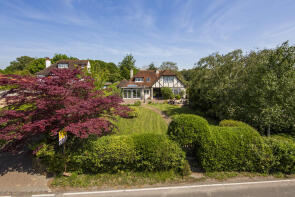
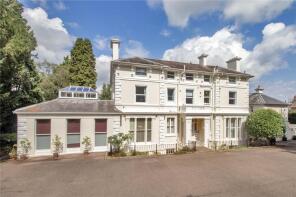
The majority of properties sold in Broadwater Down during the last year were detached properties, selling for an average price of £1,070,346. Flats sold for an average of £352,288, with terraced properties fetching £486,857.
Overall, the historical sold prices in Broadwater Down over the last year were 3% up on the previous year and 2% down on the 2023 peak of £683,347.
Properties Sold
Apartment 78, The Potteries, Linden Park Road, Tunbridge Wells TN2 5FS
| Today | See what it's worth now |
| 26 Mar 2026 | £317,500 |
| 30 Sep 2021 | £315,000 |
No other historical records.
26, Tudor Court, Tunbridge Wells TN2 5QH
| Today | See what it's worth now |
| 20 Mar 2026 | £158,000 |
| 5 Dec 2014 | £119,000 |
36, Hawkenbury Road, Tunbridge Wells TN2 5BJ
| Today | See what it's worth now |
| 19 Mar 2026 | £640,000 |
| 3 Dec 2015 | £505,000 |
35, Nelson Road, Tunbridge Wells TN2 5AW
| Today | See what it's worth now |
| 12 Mar 2026 | £510,000 |
| 15 Feb 2019 | £450,000 |
37, Tudor Court, Tunbridge Wells TN2 5QH
| Today | See what it's worth now |
| 2 Mar 2026 | £225,000 |
| 1 Sep 2017 | £215,000 |
20, Cumberland Walk, Tunbridge Wells TN1 1UJ
| Today | See what it's worth now |
| 2 Mar 2026 | £2,250,000 |
| 10 Mar 2004 | £1,100,000 |
121, Showfields Road, Tunbridge Wells TN2 5UN
| Today | See what it's worth now |
| 25 Feb 2026 | £285,000 |
| 13 Sep 2019 | £258,000 |
17, Clarendon Way, Tunbridge Wells TN2 5LD
| Today | See what it's worth now |
| 20 Feb 2026 | £522,000 |
| 24 Jan 2007 | £305,000 |
No other historical records.
7, Cumberland Mews, Tunbridge Wells TN1 1TU
| Today | See what it's worth now |
| 16 Feb 2026 | £750,000 |
| 30 Jan 2015 | £435,000 |
210, Forest Road, Tunbridge Wells TN2 5JB
| Today | See what it's worth now |
| 16 Feb 2026 | £985,000 |
| 29 Jun 2015 | £715,000 |
5, Forest Way, Tunbridge Wells TN2 5HA
| Today | See what it's worth now |
| 12 Feb 2026 | £940,000 |
| 25 Nov 1996 | £158,000 |
No other historical records.
6, Roundhill Road, Tunbridge Wells TN2 5HH
| Today | See what it's worth now |
| 5 Feb 2026 | £725,000 |
| 13 Mar 2007 | £312,500 |
No other historical records.
19, Forest Way, Tunbridge Wells TN2 5HB
| Today | See what it's worth now |
| 29 Jan 2026 | £850,000 |
| 15 Aug 2013 | £550,000 |
42, Broadmead, Tunbridge Wells TN2 5RL
| Today | See what it's worth now |
| 23 Jan 2026 | £400,000 |
| 7 Apr 2006 | £193,500 |
2, Hawkenbury Mead, Tunbridge Wells TN2 5BU
| Today | See what it's worth now |
| 21 Jan 2026 | £250,000 |
| 4 Dec 2014 | £185,000 |
10, Cobbetts Ride, Royal Tunbridge Wells TN2 5QG
| Today | See what it's worth now |
| 20 Jan 2026 | £345,000 |
No other historical records.
Flat 1, 8, Frant Road, Tunbridge Wells TN2 5SE
| Today | See what it's worth now |
| 19 Jan 2026 | £450,000 |
| 28 Oct 2019 | £325,000 |
No other historical records.
36, Gloucester Place, Linden Fields, Tunbridge Wells TN2 5QW
| Today | See what it's worth now |
| 9 Jan 2026 | £180,500 |
| 3 Aug 2006 | £250,000 |
Trosley, Camden Park, Royal Tunbridge Wells TN2 5BB
| Today | See what it's worth now |
| 5 Jan 2026 | £930,000 |
No other historical records.
28, Dorset Road, Tunbridge Wells TN2 5AP

| Today | See what it's worth now |
| 19 Dec 2025 | £425,000 |
| 15 Mar 2004 | £205,000 |
1, Banner Farm Road, Tunbridge Wells TN2 5EA
| Today | See what it's worth now |
| 19 Dec 2025 | £1,080,000 |
| 1 Sep 2017 | £615,000 |
4, St Georges Park, Tunbridge Wells TN2 5NT
| Today | See what it's worth now |
| 18 Dec 2025 | £696,000 |
| 13 Oct 2023 | £727,500 |
37, Bayham Road, Tunbridge Wells TN2 5HU
| Today | See what it's worth now |
| 5 Dec 2025 | £1,400,000 |
| 30 Jun 2011 | £570,000 |
47, Bayham Road, Tunbridge Wells TN2 5HU
| Today | See what it's worth now |
| 2 Dec 2025 | £975,000 |
| 6 Feb 2013 | £810,000 |
No other historical records.
Flat 4, 22 Down House, Broadwater Down, Tunbridge Wells TN2 5NR
| Today | See what it's worth now |
| 28 Nov 2025 | £390,000 |
| 16 Aug 2010 | £265,000 |
Source Acknowledgement: © Crown copyright. England and Wales house price data is publicly available information produced by the HM Land Registry.This material was last updated on 15 May 2026. It covers the period from 1 January 1995 to 31 March 2026 and contains property transactions which have been registered during that period. Contains HM Land Registry data © Crown copyright and database right 2026. This data is licensed under the Open Government Licence v3.0.
Disclaimer: Rightmove.co.uk provides this HM Land Registry data "as is". The burden for fitness of the data relies completely with the user and is provided for informational purposes only. No warranty, express or implied, is given relating to the accuracy of content of the HM Land Registry data and Rightmove does not accept any liability for error or omission. If you have found an error with the data or need further information please contact HM Land Registry.
Permitted Use: Viewers of this Information are granted permission to access this Crown copyright material and to download it onto electronic, magnetic, optical or similar storage media provided that such activities are for private research, study or in-house use only. Any other use of the material requires the formal written permission of Land Registry which can be requested from us, and is subject to an additional licence and associated charge.
Map data ©OpenStreetMap contributors.
Rightmove takes no liability for your use of, or reliance on, Rightmove's Instant Valuation due to the limitations of our tracking tool listed here. Use of this tool is taken entirely at your own risk. All rights reserved.