
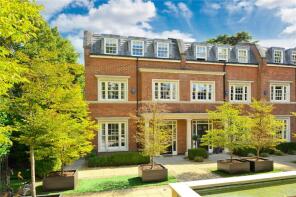
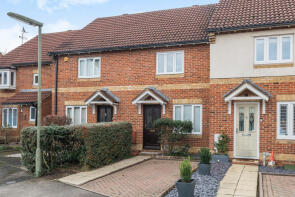
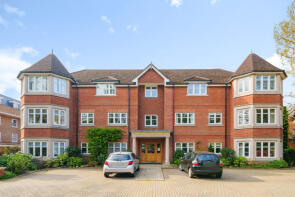
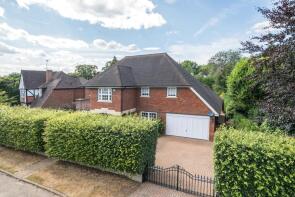
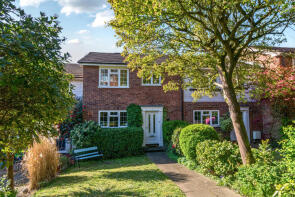
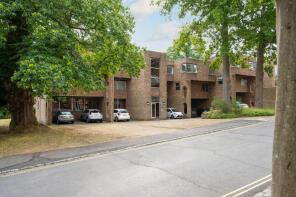
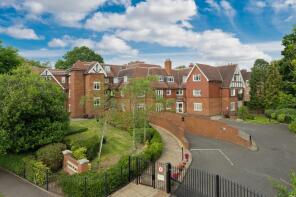
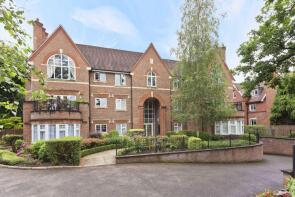
House Prices in Brooklands
House prices in Brooklands have an overall average of £1,161,236 over the last year.
The majority of properties sold in Brooklands during the last year were detached properties, selling for an average price of £2,004,875. Flats sold for an average of £465,382, with terraced properties fetching £770,444.
Overall, the historical sold prices in Brooklands over the last year were 21% up on the previous year and 31% down on the 2023 peak of £1,694,818.
Properties Sold
23, Davis Road, Weybridge KT13 0XH

| Today | See what it's worth now |
| 15 Apr 2026 | £405,000 |
| 5 Apr 2005 | £225,000 |
51, Netherby Park, Weybridge KT13 0AG
| Today | See what it's worth now |
| 1 Apr 2026 | £955,000 |
| 13 Aug 2021 | £830,000 |
No other historical records.
49, Eyston Drive, Weybridge KT13 0XD
| Today | See what it's worth now |
| 31 Mar 2026 | £470,000 |
| 18 Sep 2020 | £425,000 |
20, Elgin Place, St Georges Avenue, Weybridge KT13 0BE
| Today | See what it's worth now |
| 20 Mar 2026 | £575,000 |
| 22 Nov 1999 | £410,000 |
No other historical records.
35, Stoneleigh Park, Weybridge KT13 0DZ
| Today | See what it's worth now |
| 12 Mar 2026 | £260,000 |
No other historical records.
2 Marlborough House, Warrenhurst Gardens, Weybridge KT13 0EJ
| Today | See what it's worth now |
| 29 Jan 2026 | £1,400,000 |
| 8 Mar 2012 | £1,350,000 |
No other historical records.
14, Mays Close, Weybridge KT13 0XL
| Today | See what it's worth now |
| 23 Jan 2026 | £419,000 |
| 15 Jan 1998 | £105,950 |
Flat 5, 46 Warbeck House, Queens Road, Weybridge KT13 0AW
| Today | See what it's worth now |
| 20 Jan 2026 | £475,000 |
| 18 Nov 2005 | £305,000 |
Mimosa House, Southfield Place, Weybridge KT13 0RQ
| Today | See what it's worth now |
| 9 Jan 2026 | £1,805,000 |
| 30 Apr 2019 | £1,452,750 |
3, Julian Hill, Weybridge KT13 0RA
| Today | See what it's worth now |
| 12 Dec 2025 | £570,000 |
| 6 Sep 2021 | £550,000 |
57, Stroudwater Park, Weybridge KT13 0DT
| Today | See what it's worth now |
| 11 Dec 2025 | £425,000 |
| 8 Jul 2019 | £355,000 |
Flat 11, Cleve Place, Bridgewater Road, Weybridge KT13 0ER
| Today | See what it's worth now |
| 11 Dec 2025 | £470,000 |
| 25 Jun 2021 | £500,000 |
Flat 1, 50 Queen Elizabeth House, Queens Road, Weybridge KT13 0AZ
| Today | See what it's worth now |
| 10 Dec 2025 | £420,000 |
| 14 Apr 2008 | £395,000 |
2, Kingsway Terrace, Locke King Road, Weybridge KT13 0SX
| Today | See what it's worth now |
| 1 Dec 2025 | £485,000 |
| 13 Jul 2017 | £450,000 |
Mulberry Lodge, Old Avenue, Weybridge KT13 0PS

| Today | See what it's worth now |
| 21 Nov 2025 | £2,950,000 |
| 7 Jan 2021 | £2,300,000 |
59, Ellesmere Road, Weybridge KT13 0HW
| Today | See what it's worth now |
| 14 Nov 2025 | £1,425,000 |
| 13 Sep 2013 | £650,000 |
43, Brooklands Road, Weybridge KT13 0RU
| Today | See what it's worth now |
| 10 Nov 2025 | £710,000 |
No other historical records.
Flat 1, Abbeylands, Cobbetts Hill, Weybridge KT13 0UB
| Today | See what it's worth now |
| 6 Nov 2025 | £780,000 |
| 24 Oct 2007 | £425,000 |
Windsor Cottage, Old Avenue, Weybridge KT13 0PG
| Today | See what it's worth now |
| 3 Nov 2025 | £1,375,000 |
| 7 Dec 2016 | £915,000 |
46, Kaye Don Way, Weybridge KT13 0UX
| Today | See what it's worth now |
| 28 Oct 2025 | £445,000 |
| 20 Jun 2013 | £258,230 |
16, Fernihough Close, Weybridge KT13 0UY
| Today | See what it's worth now |
| 28 Oct 2025 | £530,000 |
| 29 Feb 2008 | £335,000 |
Flat 6, Eldon Court, St Georges Avenue, Weybridge KT13 0DB
| Today | See what it's worth now |
| 28 Oct 2025 | £310,000 |
| 1 Dec 1998 | £107,000 |
No other historical records.
11, Hillbrook Gardens, Weybridge KT13 0SP
| Today | See what it's worth now |
| 23 Oct 2025 | £300,000 |
No other historical records.
Source Acknowledgement: © Crown copyright. England and Wales house price data is publicly available information produced by the HM Land Registry.This material was last updated on 9 July 2026. It covers the period from 1 January 1995 to 30 April 2026 and contains property transactions which have been registered during that period. Contains HM Land Registry data © Crown copyright and database right 2026. This data is licensed under the Open Government Licence v3.0.
Disclaimer: Rightmove.co.uk provides this HM Land Registry data "as is". The burden for fitness of the data relies completely with the user and is provided for informational purposes only. No warranty, express or implied, is given relating to the accuracy of content of the HM Land Registry data and Rightmove does not accept any liability for error or omission. If you have found an error with the data or need further information please contact HM Land Registry.
Permitted Use: Viewers of this Information are granted permission to access this Crown copyright material and to download it onto electronic, magnetic, optical or similar storage media provided that such activities are for private research, study or in-house use only. Any other use of the material requires the formal written permission of Land Registry which can be requested from us, and is subject to an additional licence and associated charge.
Rightmove takes no liability for your use of, or reliance on, Rightmove's Instant Valuation due to the limitations of our tracking tool listed here. Use of this tool is taken entirely at your own risk. All rights reserved.