
House Prices in Browndown
House prices in Browndown have an overall average of £326,449 over the last year.
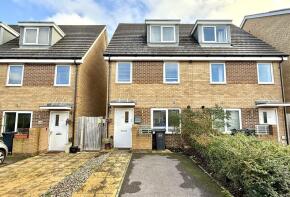
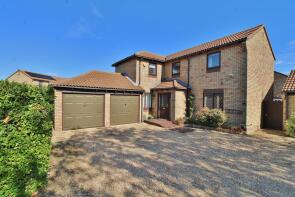
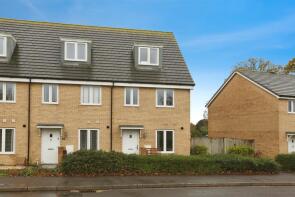
The majority of properties sold in Browndown during the last year were terraced properties, selling for an average price of £268,270. Detached properties sold for an average of £545,628, with flats fetching £187,630.
Overall, the historical sold prices in Browndown over the last year were 2% down on the previous year and 2% up on the 2022 peak of £319,332.
Properties Sold
10, Glenney Close, Lee-on-the-solent PO13 8FD
| Today | See what it's worth now |
| 22 Apr 2026 | £489,950 |
| 31 Oct 2003 | £250,000 |
No other historical records.
74, Portsmouth Road, Lee-on-the-solent PO13 9AF
| Today | See what it's worth now |
| 20 Apr 2026 | £615,000 |
| 20 Apr 1999 | £162,000 |
No other historical records.
37, Courageous Road, Lee-on-the-solent PO13 9GD
| Today | See what it's worth now |
| 10 Apr 2026 | £370,000 |
| 16 Feb 2021 | £357,500 |
No other historical records.
38, Leamington Crescent, Lee-on-the-solent PO13 9HN
| Today | See what it's worth now |
| 10 Apr 2026 | £400,000 |
No other historical records.
1, Magennis Close, Gosport PO13 9PP
| Today | See what it's worth now |
| 7 Apr 2026 | £235,000 |
| 29 Aug 1997 | £63,950 |
No other historical records.
19, Solebay Way, Gosport PO13 8NQ
| Today | See what it's worth now |
| 3 Apr 2026 | £290,000 |
| 1 Nov 2019 | £237,000 |
19, Agincourt Avenue, Gosport PO13 8NU
| Today | See what it's worth now |
| 31 Mar 2026 | £315,000 |
| 13 Dec 2017 | £259,000 |
No other historical records.
12, Headley Close, Lee-on-the-solent PO13 8HX
| Today | See what it's worth now |
| 27 Mar 2026 | £290,000 |
| 23 Mar 2018 | £220,000 |
84, Skipper Way, Lee-on-the-solent PO13 9EZ
| Today | See what it's worth now |
| 27 Mar 2026 | £260,000 |
| 30 Nov 2018 | £199,000 |
56, David Newberry Drive, Lee-on-the-solent PO13 8FE
| Today | See what it's worth now |
| 27 Mar 2026 | £400,000 |
| 18 May 2012 | £238,000 |
61, Westland Drive, Lee-on-the-solent PO13 8GH
| Today | See what it's worth now |
| 27 Mar 2026 | £600,000 |
| 19 Sep 2014 | £385,000 |
31, Osprey Gardens, Lee-on-the-solent PO13 8LJ
| Today | See what it's worth now |
| 27 Mar 2026 | £105,000 |
| 7 Aug 1998 | £28,000 |
128, Blanchard Avenue, Gosport PO13 8NR
| Today | See what it's worth now |
| 27 Mar 2026 | £295,000 |
| 15 Mar 2017 | £237,500 |
No other historical records.
12, Blackbird Way, Lee-on-the-solent PO13 8HJ
| Today | See what it's worth now |
| 27 Mar 2026 | £502,167 |
| 11 Mar 2014 | £350,000 |
15, Montrose Walk, Howe Road, Gosport PO13 8PA
| Today | See what it's worth now |
| 27 Mar 2026 | £306,500 |
| 22 Nov 2019 | £245,000 |
No other historical records.
70, Wootton Road, Lee-on-the-solent PO13 9HB
| Today | See what it's worth now |
| 26 Mar 2026 | £416,500 |
| 16 Dec 2022 | £420,000 |
202, St Nicholas Avenue, Gosport PO13 9RP
| Today | See what it's worth now |
| 25 Mar 2026 | £172,000 |
| 17 Dec 2003 | £90,000 |
Flat 47, Hometide House, Beach Road, Lee-on-the-solent PO13 9BP
| Today | See what it's worth now |
| 20 Mar 2026 | £104,947 |
| 2 Jun 2016 | £94,995 |
1a, Elmore Avenue, Lee-on-the-solent PO13 9EP
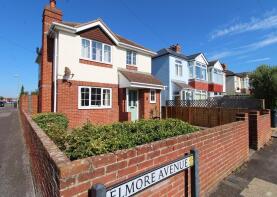
| Today | See what it's worth now |
| 19 Mar 2026 | £386,000 |
| 16 Oct 2006 | £205,500 |
Flat 3, Hometide House, Beach Road, Lee-on-the-solent PO13 9BP
| Today | See what it's worth now |
| 19 Mar 2026 | £100,000 |
| 31 Oct 2003 | £55,950 |
2, Wootton Road, Lee-on-the-solent PO13 9HB
| Today | See what it's worth now |
| 19 Mar 2026 | £547,500 |
| 31 Oct 2023 | £547,500 |
24, Sea Crest Road, Lee-on-the-solent PO13 8HH
| Today | See what it's worth now |
| 18 Mar 2026 | £298,000 |
| 6 Apr 2022 | £280,000 |
54, Fell Drive, Lee-on-the-solent PO13 8JR

| Today | See what it's worth now |
| 13 Mar 2026 | £272,000 |
| 6 Jul 2012 | £152,000 |
No other historical records.
Source Acknowledgement: © Crown copyright. England and Wales house price data is publicly available information produced by the HM Land Registry.This material was last updated on 9 July 2026. It covers the period from 1 January 1995 to 30 April 2026 and contains property transactions which have been registered during that period. Contains HM Land Registry data © Crown copyright and database right 2026. This data is licensed under the Open Government Licence v3.0.
Disclaimer: Rightmove.co.uk provides this HM Land Registry data "as is". The burden for fitness of the data relies completely with the user and is provided for informational purposes only. No warranty, express or implied, is given relating to the accuracy of content of the HM Land Registry data and Rightmove does not accept any liability for error or omission. If you have found an error with the data or need further information please contact HM Land Registry.
Permitted Use: Viewers of this Information are granted permission to access this Crown copyright material and to download it onto electronic, magnetic, optical or similar storage media provided that such activities are for private research, study or in-house use only. Any other use of the material requires the formal written permission of Land Registry which can be requested from us, and is subject to an additional licence and associated charge.
Rightmove takes no liability for your use of, or reliance on, Rightmove's Instant Valuation due to the limitations of our tracking tool listed here. Use of this tool is taken entirely at your own risk. All rights reserved.