
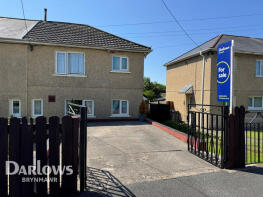
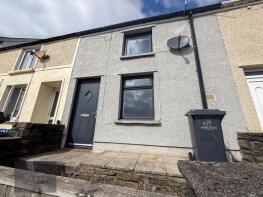
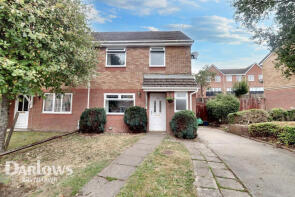
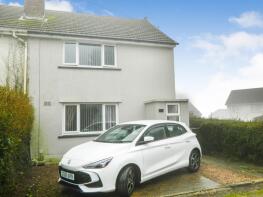
House Prices in Brynmawr
House prices in Brynmawr have an overall average of £177,574 over the last year.
The majority of properties sold in Brynmawr during the last year were terraced properties, selling for an average price of £128,289. Semi-detached properties sold for an average of £180,746, with detached properties fetching £305,000.
Overall, the historical sold prices in Brynmawr over the last year were 11% up on the previous year and 13% up on the 2023 peak of £156,745.
Properties Sold
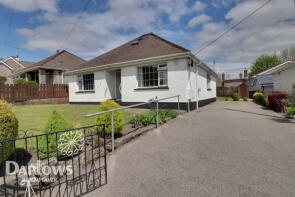
Llan Fair, Rhyd Clydach, Ebbw Vale NP23 4SJ
| Today | See what it's worth now |
| 17 Mar 2026 | £370,000 |
| 25 Sep 2025 | £230,000 |
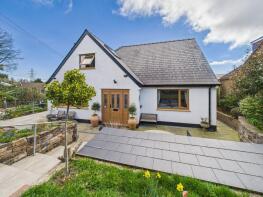
Greenways, Intermediate Road, Brynmawr NP23 4SE
| Today | See what it's worth now |
| 10 Mar 2026 | £400,000 |
No other historical records.
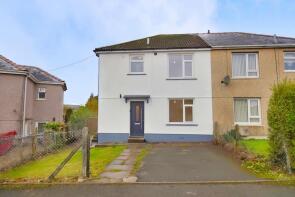
17, Osborne Road, Brynmawr NP23 4HQ
| Today | See what it's worth now |
| 20 Feb 2026 | £199,950 |
No other historical records.
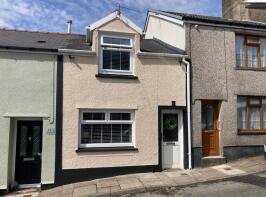
10, Glamorgan Street, Ebbw Vale NP23 4SS
| Today | See what it's worth now |
| 19 Feb 2026 | £123,000 |
| 4 Jan 2019 | £69,000 |
52, Worcester Street, Ebbw Vale NP23 4JP
| Today | See what it's worth now |
| 19 Feb 2026 | £150,000 |
| 9 Oct 2020 | £61,500 |
No other historical records.
Greenland Cottage, Old Blaenavon Road, Ebbw Vale NP23 4BP
| Today | See what it's worth now |
| 12 Feb 2026 | £255,000 |
| 25 Jun 2010 | £164,950 |
17 Arfryn, Clydach Street, Ebbw Vale NP23 4RL

| Today | See what it's worth now |
| 10 Feb 2026 | £295,000 |
| 16 Aug 2019 | £162,000 |
No other historical records.
116, Worcester Street, Ebbw Vale NP23 4DF

| Today | See what it's worth now |
| 16 Jan 2026 | £115,000 |
| 18 Mar 2022 | £103,000 |
No other historical records.
24, Clydach Street, Ebbw Vale NP23 4RN
| Today | See what it's worth now |
| 6 Jan 2026 | £137,000 |
| 7 Jun 2022 | £134,950 |
44, George Street, Ebbw Vale NP23 4TW
| Today | See what it's worth now |
| 19 Dec 2025 | £141,000 |
| 2 Jun 2023 | £93,000 |
3, Lansbury Road, Ebbw Vale NP23 4HY
| Today | See what it's worth now |
| 19 Dec 2025 | £139,000 |
| 15 Feb 2013 | £67,000 |
No other historical records.
28, Glamorgan Street, Ebbw Vale NP23 4JZ

| Today | See what it's worth now |
| 19 Dec 2025 | £105,000 |
| 25 Jul 2022 | £80,000 |
No other historical records.
91, King Street, Ebbw Vale NP23 4SY
| Today | See what it's worth now |
| 16 Dec 2025 | £63,000 |
| 7 Oct 2022 | £122,000 |
35, Hafod View Close, Ebbw Vale NP23 4AT
| Today | See what it's worth now |
| 5 Dec 2025 | £200,000 |
| 21 Feb 2022 | £178,000 |
46, Hafod View Close, Ebbw Vale NP23 4AT
| Today | See what it's worth now |
| 21 Nov 2025 | £186,000 |
| 31 Mar 2017 | £115,000 |
20, Birch Grove, Ebbw Vale NP23 4TD
| Today | See what it's worth now |
| 14 Nov 2025 | £130,000 |
| 4 Mar 2016 | £65,000 |
2, Croft Court, Ebbw Vale NP23 4SU
| Today | See what it's worth now |
| 27 Oct 2025 | £200,000 |
| 18 Mar 2020 | £125,000 |
75, Bailey Street, Ebbw Vale NP23 4AH
| Today | See what it's worth now |
| 23 Oct 2025 | £152,500 |
| 27 Nov 2023 | £145,000 |
34, Warwick Road, Ebbw Vale NP23 4HW
| Today | See what it's worth now |
| 3 Oct 2025 | £217,000 |
| 9 Jun 2022 | £175,000 |
150, King Street, Ebbw Vale NP23 4SU
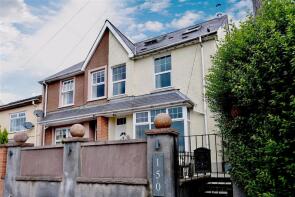
| Today | See what it's worth now |
| 26 Sep 2025 | £226,500 |
| 7 Apr 2017 | £157,000 |
54, King Street, Ebbw Vale NP23 4RF

| Today | See what it's worth now |
| 19 Sep 2025 | £134,000 |
| 28 Jul 2017 | £90,000 |
16, Clarence Street, Brynmawr NP23 4EH
| Today | See what it's worth now |
| 19 Sep 2025 | £120,000 |
No other historical records.
4, Birch Grove, Brynmawr NP23 4TD

| Today | See what it's worth now |
| 5 Sep 2025 | £172,000 |
No other historical records.
Source Acknowledgement: © Crown copyright. England and Wales house price data is publicly available information produced by the HM Land Registry.This material was last updated on 9 July 2026. It covers the period from 1 January 1995 to 30 April 2026 and contains property transactions which have been registered during that period. Contains HM Land Registry data © Crown copyright and database right 2026. This data is licensed under the Open Government Licence v3.0.
Disclaimer: Rightmove.co.uk provides this HM Land Registry data "as is". The burden for fitness of the data relies completely with the user and is provided for informational purposes only. No warranty, express or implied, is given relating to the accuracy of content of the HM Land Registry data and Rightmove does not accept any liability for error or omission. If you have found an error with the data or need further information please contact HM Land Registry.
Permitted Use: Viewers of this Information are granted permission to access this Crown copyright material and to download it onto electronic, magnetic, optical or similar storage media provided that such activities are for private research, study or in-house use only. Any other use of the material requires the formal written permission of Land Registry which can be requested from us, and is subject to an additional licence and associated charge.
Rightmove takes no liability for your use of, or reliance on, Rightmove's Instant Valuation due to the limitations of our tracking tool listed here. Use of this tool is taken entirely at your own risk. All rights reserved.