
House Prices in Bulwell
House prices in Bulwell have an overall average of £179,885 over the last year.
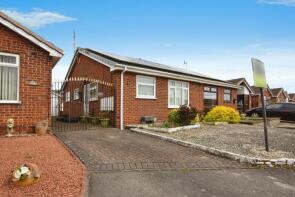
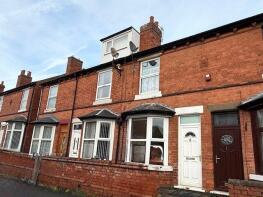
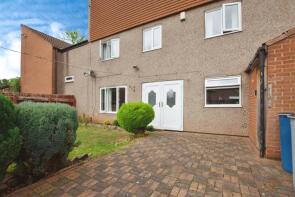
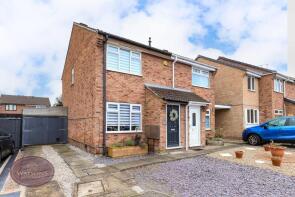
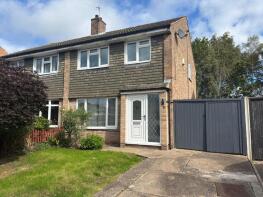
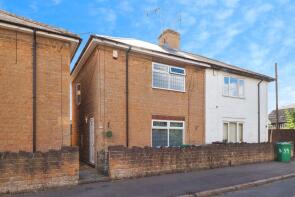
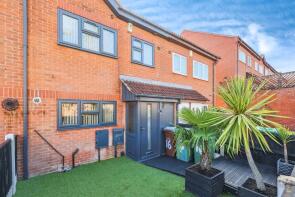
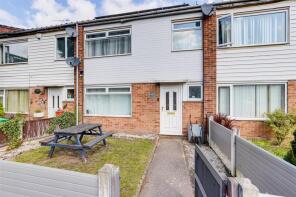
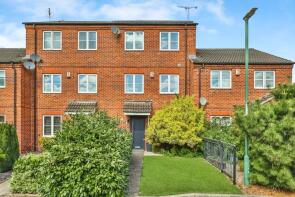
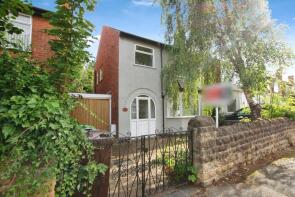
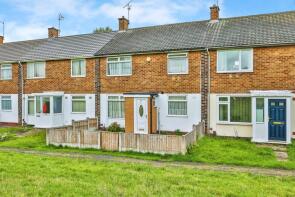
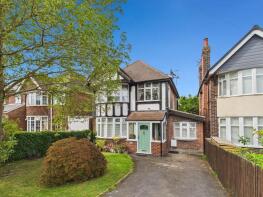
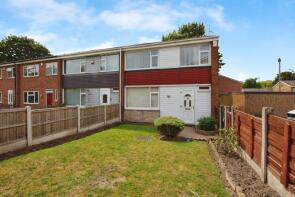
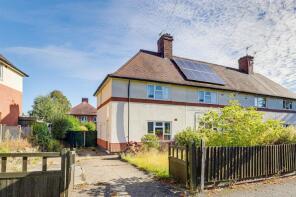
The majority of properties sold in Bulwell during the last year were terraced properties, selling for an average price of £150,926. Semi-detached properties sold for an average of £189,640, with detached properties fetching £231,659.
Overall, the historical sold prices in Bulwell over the last year were 5% up on the previous year and 7% up on the 2023 peak of £167,456.
Properties Sold
11, Turnberry Road, Nottingham NG6 9LY
| Today | See what it's worth now |
| 17 Apr 2026 | £170,000 |
| 28 Feb 2017 | £135,000 |
6, Edgware Road, Nottingham NG6 9HW
| Today | See what it's worth now |
| 17 Apr 2026 | £106,500 |
| 27 Mar 1997 | £23,000 |
No other historical records.
45, Corben Gardens, Nottingham NG6 7FE
| Today | See what it's worth now |
| 14 Apr 2026 | £165,000 |
| 25 Feb 2005 | £70,500 |
No other historical records.
51, Bannerman Road, Nottingham NG6 9JA
| Today | See what it's worth now |
| 31 Mar 2026 | £140,000 |
| 27 Jul 2023 | £130,000 |
8, Downes Close, Nottingham NG6 7DU
| Today | See what it's worth now |
| 26 Mar 2026 | £170,000 |
| 24 Mar 2023 | £150,725 |
87, Repton Road, Nottingham NG6 9GF
| Today | See what it's worth now |
| 25 Mar 2026 | £170,000 |
| 18 Apr 2008 | £86,950 |
74, Saxondale Drive, Nottingham NG6 9EH
| Today | See what it's worth now |
| 24 Mar 2026 | £190,000 |
| 10 Sep 2021 | £125,000 |
No other historical records.
21, Apollo Drive, Nottingham NG6 7AD
| Today | See what it's worth now |
| 20 Mar 2026 | £230,000 |
| 30 Apr 2004 | £99,950 |
31, Turnberry Road, Nottingham NG6 9LY
| Today | See what it's worth now |
| 19 Mar 2026 | £240,450 |
No other historical records.
9, Mattingly Road, Nottingham NG6 7BD
| Today | See what it's worth now |
| 19 Mar 2026 | £195,000 |
| 15 Aug 2007 | £125,000 |
No other historical records.
17, Spindle Gardens, Nottingham NG6 7DG
| Today | See what it's worth now |
| 16 Mar 2026 | £71,500 |
No other historical records.
57, Mersey Street, Nottingham NG6 8JA
| Today | See what it's worth now |
| 13 Mar 2026 | £142,500 |
| 18 Jan 2019 | £90,500 |
No other historical records.
16, Bonington Close, Nottingham NG6 8AU
| Today | See what it's worth now |
| 6 Mar 2026 | £170,000 |
No other historical records.
35, Lathkill Close, Nottingham NG6 8SQ
| Today | See what it's worth now |
| 27 Feb 2026 | £164,000 |
| 24 Feb 2021 | £132,500 |
46, Fenton Drive, Nottingham NG6 8DE

| Today | See what it's worth now |
| 27 Feb 2026 | £162,000 |
| 29 Jun 2018 | £95,500 |
No other historical records.
45, Highbury Avenue, Nottingham NG6 9DB
| Today | See what it's worth now |
| 27 Feb 2026 | £255,000 |
| 8 Jul 2005 | £157,995 |
No other historical records.
140, Broomhill Road, Nottingham NG6 9GJ
| Today | See what it's worth now |
| 26 Feb 2026 | £190,000 |
| 24 Jun 2005 | £119,950 |
No other historical records.
97, Austin Street, Nottingham NG6 9HE
| Today | See what it's worth now |
| 26 Feb 2026 | £155,000 |
| 15 Jun 2006 | £72,000 |
71, Wingbourne Walk, Nottingham NG6 8DT
| Today | See what it's worth now |
| 26 Feb 2026 | £143,000 |
| 28 Feb 2013 | £71,000 |
No other historical records.
374, St Albans Road, Nottingham NG6 9FR
| Today | See what it's worth now |
| 19 Feb 2026 | £315,000 |
| 21 Jan 2008 | £167,000 |
54, Deptford Crescent, Nottingham NG6 9DJ
| Today | See what it's worth now |
| 18 Feb 2026 | £153,000 |
No other historical records.
44, Grindon Crescent, Nottingham NG6 8BQ
| Today | See what it's worth now |
| 13 Feb 2026 | £147,000 |
| 28 Feb 2025 | £147,000 |
No other historical records.
190, Cinderhill Road, Nottingham NG6 8RL
| Today | See what it's worth now |
| 13 Feb 2026 | £155,000 |
| 29 Sep 2014 | £115,000 |
Source Acknowledgement: © Crown copyright. England and Wales house price data is publicly available information produced by the HM Land Registry.This material was last updated on 9 July 2026. It covers the period from 1 January 1995 to 30 April 2026 and contains property transactions which have been registered during that period. Contains HM Land Registry data © Crown copyright and database right 2026. This data is licensed under the Open Government Licence v3.0.
Disclaimer: Rightmove.co.uk provides this HM Land Registry data "as is". The burden for fitness of the data relies completely with the user and is provided for informational purposes only. No warranty, express or implied, is given relating to the accuracy of content of the HM Land Registry data and Rightmove does not accept any liability for error or omission. If you have found an error with the data or need further information please contact HM Land Registry.
Permitted Use: Viewers of this Information are granted permission to access this Crown copyright material and to download it onto electronic, magnetic, optical or similar storage media provided that such activities are for private research, study or in-house use only. Any other use of the material requires the formal written permission of Land Registry which can be requested from us, and is subject to an additional licence and associated charge.
Rightmove takes no liability for your use of, or reliance on, Rightmove's Instant Valuation due to the limitations of our tracking tool listed here. Use of this tool is taken entirely at your own risk. All rights reserved.