
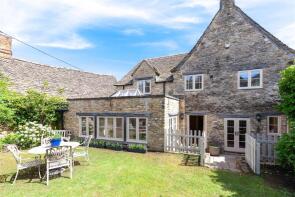
House Prices in Burford
House prices in Burford have an overall average of £883,697 over the last year.
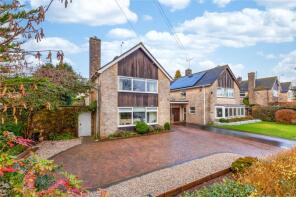
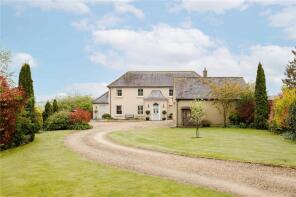
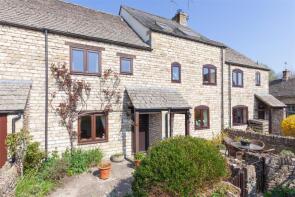
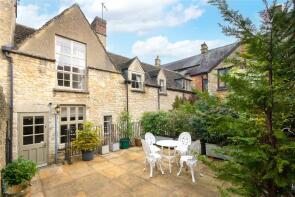
The majority of properties sold in Burford during the last year were detached properties, selling for an average price of £1,425,000. Terraced properties sold for an average of £447,450, with semi-detached properties fetching £493,333.
Overall, the historical sold prices in Burford over the last year were 47% up on the previous year and 8% up on the 2022 peak of £818,438.
Properties Sold
48, Frethern Close, Burford OX18 4NX
| Today | See what it's worth now |
| 16 Apr 2026 | £380,000 |
| 18 Dec 2023 | £230,000 |
No other historical records.
16 Tanfield, Tanners Lane, Burford OX18 4NB
| Today | See what it's worth now |
| 20 Mar 2026 | £1,950,000 |
| 19 May 2014 | £995,000 |
13, Forest Grove, Burford OX18 4FF
| Today | See what it's worth now |
| 19 Feb 2026 | £450,000 |
| 23 Feb 2024 | £425,000 |
No other historical records.
3, Forest Grove, Burford OX18 4FF
| Today | See what it's worth now |
| 26 Jan 2026 | £685,000 |
| 30 Apr 2021 | £585,000 |
No other historical records.
3 The Coach House, Witney Street, Burford OX18 4SN
| Today | See what it's worth now |
| 18 Dec 2025 | £728,000 |
| 30 Nov 2010 | £360,000 |
No other historical records.
50, Witney Street, Burford OX18 4SN
| Today | See what it's worth now |
| 25 Nov 2025 | £365,000 |
No other historical records.
9, Sylvester Close, Burford OX18 4RU
| Today | See what it's worth now |
| 14 Nov 2025 | £315,000 |
| 27 Feb 2004 | £236,000 |
In Between Cottage, High Street, Burford OX18 4QF
| Today | See what it's worth now |
| 23 Oct 2025 | £625,000 |
No other historical records.
35, Forest Grove, Burford OX18 4FF

| Today | See what it's worth now |
| 22 Oct 2025 | £542,500 |
| 8 Mar 2022 | £575,000 |
No other historical records.
Briarfield, Barns Lane, Burford OX18 4NE
| Today | See what it's worth now |
| 3 Oct 2025 | £615,000 |
| 15 Apr 2011 | £364,000 |
Little Ham, Road From Burford To Fulbrook Hill, Fulbrook, Burford OX18 4BD

| Today | See what it's worth now |
| 3 Oct 2025 | £2,120,000 |
| 16 Sep 2022 | £2,120,000 |
Leaze House, Barns Lane, Burford OX18 4NE
| Today | See what it's worth now |
| 19 Sep 2025 | £1,400,000 |
| 13 Jul 2015 | £727,500 |
12, Sylvester Close, Burford OX18 4RU
| Today | See what it's worth now |
| 8 Sep 2025 | £389,750 |
No other historical records.
142b The Old Ropery Cottage, High Street, Burford OX18 4QU
| Today | See what it's worth now |
| 22 Aug 2025 | £850,000 |
| 15 May 2023 | £650,000 |
44, Witney Street, Burford OX18 4SN
| Today | See what it's worth now |
| 11 Aug 2025 | £485,000 |
| 20 Nov 2020 | £385,000 |
4, Burgage Gardens, Church Lane, Burford OX18 4SR
| Today | See what it's worth now |
| 6 Aug 2025 | £750,000 |
| 15 Sep 2021 | £680,000 |
10, Orchard Rise, Burford OX18 4SZ

| Today | See what it's worth now |
| 29 Jul 2025 | £917,000 |
| 16 Dec 2022 | £850,000 |
34 The Great Lodge, Witney Street, Burford OX18 4SN
| Today | See what it's worth now |
| 25 Jul 2025 | £2,850,000 |
| 27 Feb 2004 | £925,000 |
No other historical records.
19, Bishop Drive, Burford OX18 4EB
| Today | See what it's worth now |
| 15 Jul 2025 | £373,000 |
No other historical records.
59, Frethern Close, Burford OX18 4NS
| Today | See what it's worth now |
| 30 Jun 2025 | £430,000 |
No other historical records.
65, Forest Grove, Burford OX18 4FF
| Today | See what it's worth now |
| 16 Jun 2025 | £550,000 |
No other historical records.
5, Burton Mews, Burford OX18 4FE
| Today | See what it's worth now |
| 10 Jun 2025 | £485,000 |
No other historical records.
15, Forest Grove, Burford OX18 4FF
| Today | See what it's worth now |
| 6 Jun 2025 | £475,000 |
| 28 Apr 2023 | £550,000 |
No other historical records.
Source Acknowledgement: © Crown copyright. England and Wales house price data is publicly available information produced by the HM Land Registry.This material was last updated on 9 July 2026. It covers the period from 1 January 1995 to 30 April 2026 and contains property transactions which have been registered during that period. Contains HM Land Registry data © Crown copyright and database right 2026. This data is licensed under the Open Government Licence v3.0.
Disclaimer: Rightmove.co.uk provides this HM Land Registry data "as is". The burden for fitness of the data relies completely with the user and is provided for informational purposes only. No warranty, express or implied, is given relating to the accuracy of content of the HM Land Registry data and Rightmove does not accept any liability for error or omission. If you have found an error with the data or need further information please contact HM Land Registry.
Permitted Use: Viewers of this Information are granted permission to access this Crown copyright material and to download it onto electronic, magnetic, optical or similar storage media provided that such activities are for private research, study or in-house use only. Any other use of the material requires the formal written permission of Land Registry which can be requested from us, and is subject to an additional licence and associated charge.
Rightmove takes no liability for your use of, or reliance on, Rightmove's Instant Valuation due to the limitations of our tracking tool listed here. Use of this tool is taken entirely at your own risk. All rights reserved.