
House Prices in Burnham Sutton
House prices in Burnham Sutton have an overall average of £558,422 over the last year.
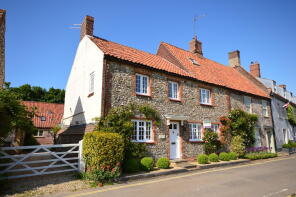
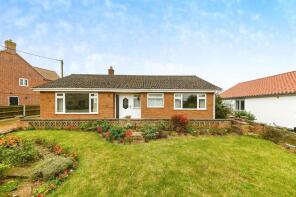
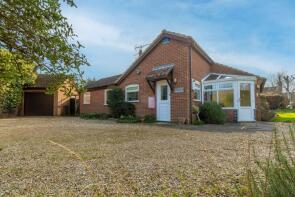
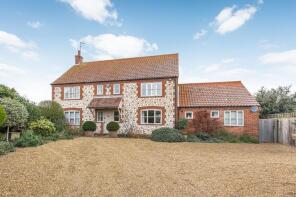
The majority of properties sold in Burnham Sutton during the last year were detached properties, selling for an average price of £598,840. Terraced properties sold for an average of £479,250, with semi-detached properties fetching £594,583.
Overall, the historical sold prices in Burnham Sutton over the last year were 21% down on the previous year and 18% down on the 2022 peak of £679,412.
Properties Sold
Crooks Cottage, Wells Road, Burnham Overy Town PE31 8HU
| Today | See what it's worth now |
| 16 Feb 2026 | £675,000 |
No other historical records.
7, Mill Green, Burnham Market PE31 8DY
| Today | See what it's worth now |
| 23 Jan 2026 | £343,000 |
No other historical records.
Meadway, Creake Road, Burnham Thorpe PE31 8HW
| Today | See what it's worth now |
| 21 Jan 2026 | £585,000 |
No other historical records.
3 Ivy Cottage, Market Place, King's Lynn PE31 8HE

| Today | See what it's worth now |
| 16 Jan 2026 | £892,500 |
| 29 Oct 2012 | £595,000 |
No other historical records.
6, The Broadlands, The Street, King's Lynn PE31 8ST
| Today | See what it's worth now |
| 16 Jan 2026 | £230,000 |
| 4 Nov 2021 | £224,000 |
11 Clare Cottage, Market Place, King's Lynn PE31 8HE
| Today | See what it's worth now |
| 16 Jan 2026 | £925,000 |
| 21 Dec 2016 | £780,000 |
Sylmond, Station Road, Docking PE31 8LT
| Today | See what it's worth now |
| 7 Jan 2026 | £320,000 |
No other historical records.
4, Norfolk Barn Yard, King's Lynn PE31 8PP


| Today | See what it's worth now |
| 17 Dec 2025 | £580,000 |
No other historical records.
Little Rising, Cross Lane, King's Lynn PE31 8AE
| Today | See what it's worth now |
| 12 Dec 2025 | £510,000 |
| 27 Oct 2005 | £275,000 |
No other historical records.
1, Sunnyside, Mission Lane, King's Lynn PE31 8NL

| Today | See what it's worth now |
| 12 Dec 2025 | £355,000 |
| 28 Jul 2010 | £215,000 |
2, Old Railway Yard, King's Lynn PE31 8UP
| Today | See what it's worth now |
| 12 Dec 2025 | £837,500 |
| 2 May 2014 | £555,000 |
Barn Breck, Field House Farm Cottages, Mill Road, Brancaster PE31 8AG
| Today | See what it's worth now |
| 10 Dec 2025 | £450,000 |
| 25 Nov 2010 | £325,000 |
Lynwood House, Main Road, Brancaster Staithe PE31 8BJ

| Today | See what it's worth now |
| 21 Nov 2025 | £828,890 |
| 25 Oct 2017 | £750,000 |
12, Roman Way, King's Lynn PE31 8XA
| Today | See what it's worth now |
| 21 Nov 2025 | £380,000 |
| 29 Jun 2001 | £110,000 |
Leetes Cottage, Bellamys Lane, King's Lynn PE31 8ES

| Today | See what it's worth now |
| 21 Nov 2025 | £425,000 |
| 25 May 2007 | £599,000 |
22, The Close, Brancaster Staithe PE31 8BS

| Today | See what it's worth now |
| 11 Nov 2025 | £320,000 |
No other historical records.
3, School Pastures, King's Lynn PE31 8DF
| Today | See what it's worth now |
| 10 Nov 2025 | £900,000 |
| 17 Jul 2009 | £485,000 |
Orchard Bungalow, Fakenham Road, Docking PE31 8NW
| Today | See what it's worth now |
| 3 Nov 2025 | £307,999 |
No other historical records.
12, Groveside, East Rudham PE31 8RL
| Today | See what it's worth now |
| 24 Oct 2025 | £240,000 |
No other historical records.
1, Grange Farm, Station Road, King's Lynn PE31 8QN
| Today | See what it's worth now |
| 22 Oct 2025 | £585,000 |
| 24 Mar 2017 | £435,000 |
Sarahs Cottage, Station Road, King's Lynn PE31 8QN

| Today | See what it's worth now |
| 20 Oct 2025 | £325,000 |
| 4 Nov 2016 | £349,995 |
8, Harefields, Station Road, King's Lynn PE31 8LL
| Today | See what it's worth now |
| 10 Oct 2025 | £390,000 |
| 29 Aug 2006 | £249,950 |
No other historical records.
1, Beechwood Court, The Street, King's Lynn PE31 8TR
| Today | See what it's worth now |
| 30 Sep 2025 | £505,500 |
| 15 May 2015 | £308,000 |
4, Skippers Piece Close, King's Lynn PE31 8EH
| Today | See what it's worth now |
| 26 Sep 2025 | £1,100,000 |
| 4 Aug 2020 | £850,000 |
No other historical records.
10, Manor Road, King's Lynn PE31 8GP
| Today | See what it's worth now |
| 25 Sep 2025 | £1,000,000 |
| 25 Oct 2023 | £1,050,000 |
No other historical records.
Source Acknowledgement: © Crown copyright. England and Wales house price data is publicly available information produced by the HM Land Registry.This material was last updated on 9 April 2026. It covers the period from 1 January 1995 to 27 February 2026 and contains property transactions which have been registered during that period. Contains HM Land Registry data © Crown copyright and database right 2026. This data is licensed under the Open Government Licence v3.0.
Disclaimer: Rightmove.co.uk provides this HM Land Registry data "as is". The burden for fitness of the data relies completely with the user and is provided for informational purposes only. No warranty, express or implied, is given relating to the accuracy of content of the HM Land Registry data and Rightmove does not accept any liability for error or omission. If you have found an error with the data or need further information please contact HM Land Registry.
Permitted Use: Viewers of this Information are granted permission to access this Crown copyright material and to download it onto electronic, magnetic, optical or similar storage media provided that such activities are for private research, study or in-house use only. Any other use of the material requires the formal written permission of Land Registry which can be requested from us, and is subject to an additional licence and associated charge.
Map data ©OpenStreetMap contributors.
Rightmove takes no liability for your use of, or reliance on, Rightmove's Instant Valuation due to the limitations of our tracking tool listed here. Use of this tool is taken entirely at your own risk. All rights reserved.