
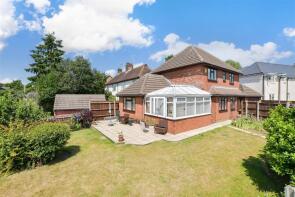
House Prices in CM12
House prices in CM12 have an overall average of £548,500 over the last year.
The majority of properties sold in CM12 during the last year were semi-detached properties, selling for an average price of £511,682. Detached properties sold for an average of £762,445, with terraced properties fetching £377,446.
Overall, the historical sold prices in CM12 over the last year were 4% up on the previous year and 2% up on the 2022 peak of £535,167.
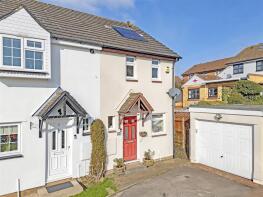
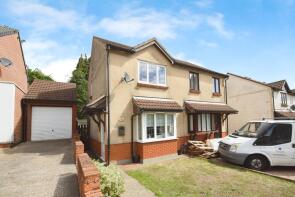
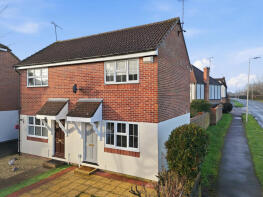
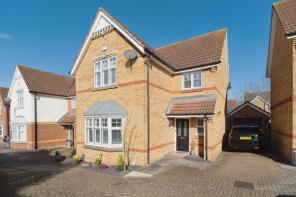
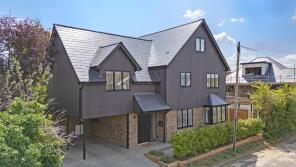
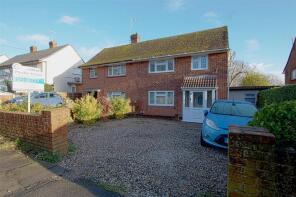
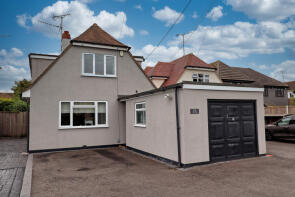
Properties Sold
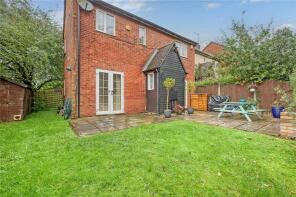
7, Sheraday Mews, High Street, Billericay CM12 9FP

| Today | See what it's worth now |
| 16 Apr 2026 | £360,000 |
| 7 Feb 2018 | £347,500 |
22, Arundel Way, Billericay CM12 0FL

| Today | See what it's worth now |
| 15 Apr 2026 | £500,000 |
| 26 Jun 2018 | £266,666 |
No other historical records.
2, School Road, Billericay CM12 9LH
| Today | See what it's worth now |
| 14 Apr 2026 | £475,000 |
| 27 May 2004 | £325,000 |
No other historical records.
Extensions and planning permission in CM12
See planning approval stats, extension build costs and value added estimates.

65, Whitesmith Drive, Billericay CM12 0FP

| Today | See what it's worth now |
| 7 Apr 2026 | £375,000 |
| 5 Sep 2014 | £275,000 |
8, Rutherford Close, Billericay CM12 0YR
| Today | See what it's worth now |
| 31 Mar 2026 | £347,500 |
| 16 Sep 2019 | £312,000 |
10, Windmill Heights, Billericay CM12 9QY
| Today | See what it's worth now |
| 31 Mar 2026 | £325,000 |
| 17 Aug 2001 | £107,000 |
5, Arundel Close, Billericay CM12 0FN
| Today | See what it's worth now |
| 31 Mar 2026 | £300,000 |
| 28 Feb 2014 | £173,000 |
32, Windmill Heights, Billericay CM12 9QY
| Today | See what it's worth now |
| 30 Mar 2026 | £545,000 |
| 14 Apr 2022 | £480,000 |
32, Tye Common Road, Billericay CM12 9ND
| Today | See what it's worth now |
| 27 Mar 2026 | £765,000 |
| 26 Sep 1996 | £175,995 |
No other historical records.
20, Celandine Close, Billericay CM12 0SU

| Today | See what it's worth now |
| 27 Mar 2026 | £365,000 |
| 12 Aug 2022 | £362,000 |
Flat 10, Monarch Place, Goldington Crescent, Billericay CM12 0GJ

| Today | See what it's worth now |
| 27 Mar 2026 | £84,000 |
| 2 Sep 2022 | £93,712 |
No other historical records.
22, Atridge Chase, Billericay CM12 0HR
| Today | See what it's worth now |
| 25 Mar 2026 | £465,000 |
| 23 Mar 2018 | £427,500 |
No other historical records.
51, Ian Road, Billericay CM12 0JZ
| Today | See what it's worth now |
| 25 Mar 2026 | £560,000 |
| 19 Sep 2003 | £240,000 |
No other historical records.
31, Regent Drive, Billericay CM12 0GD
| Today | See what it's worth now |
| 24 Mar 2026 | £600,000 |
| 8 Oct 2020 | £575,000 |
Pagets, Cherrytrees, Billericay CM12 9NY
| Today | See what it's worth now |
| 20 Mar 2026 | £962,500 |
| 19 Jul 2024 | £300,000 |
No other historical records.
Hawthorn House, Tye Common Road, Billericay CM12 9NX
| Today | See what it's worth now |
| 20 Mar 2026 | £437,500 |
No other historical records.
19, Kennel Lane, Billericay CM12 9RU
| Today | See what it's worth now |
| 19 Mar 2026 | £420,000 |
| 28 Jan 1998 | £52,000 |
No other historical records.
206, Stock Road, Billericay CM12 0SH
| Today | See what it's worth now |
| 18 Mar 2026 | £640,000 |
| 21 May 2014 | £412,000 |
No other historical records.
7, Dorset Way, Billericay CM12 0UD
| Today | See what it's worth now |
| 13 Mar 2026 | £425,000 |
| 26 May 2021 | £370,000 |
6, The Mullions, Billericay CM12 9XG
| Today | See what it's worth now |
| 13 Mar 2026 | £640,000 |
No other historical records.
1, Colville Mews, Billericay CM12 0SW
| Today | See what it's worth now |
| 13 Mar 2026 | £200,000 |
| 12 Aug 2024 | £197,500 |
31, Cromwell Avenue, Billericay CM12 0AG
| Today | See what it's worth now |
| 12 Mar 2026 | £1,050,000 |
| 1 May 1998 | £199,995 |
No other historical records.
8, Dorset Way, Billericay CM12 0UD
| Today | See what it's worth now |
| 12 Mar 2026 | £405,000 |
| 20 Oct 2017 | £365,000 |

Source Acknowledgement: © Crown copyright. England and Wales house price data is publicly available information produced by the HM Land Registry.This material was last updated on 9 July 2026. It covers the period from 1 January 1995 to 30 April 2026 and contains property transactions which have been registered during that period. Contains HM Land Registry data © Crown copyright and database right 2026. This data is licensed under the Open Government Licence v3.0.
Disclaimer: Rightmove.co.uk provides this HM Land Registry data "as is". The burden for fitness of the data relies completely with the user and is provided for informational purposes only. No warranty, express or implied, is given relating to the accuracy of content of the HM Land Registry data and Rightmove does not accept any liability for error or omission. If you have found an error with the data or need further information please contact HM Land Registry.
Permitted Use: Viewers of this Information are granted permission to access this Crown copyright material and to download it onto electronic, magnetic, optical or similar storage media provided that such activities are for private research, study or in-house use only. Any other use of the material requires the formal written permission of Land Registry which can be requested from us, and is subject to an additional licence and associated charge.
Rightmove takes no liability for your use of, or reliance on, Rightmove's Instant Valuation due to the limitations of our tracking tool listed here. Use of this tool is taken entirely at your own risk. All rights reserved.