
House Prices in CM11
House prices in CM11 have an overall average of £584,848 over the last year.
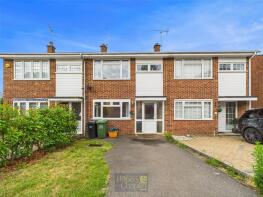
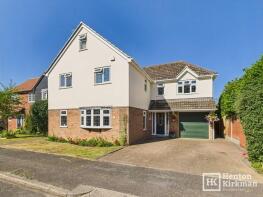
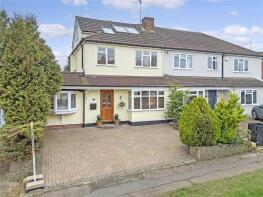
The majority of properties sold in CM11 during the last year were semi-detached properties, selling for an average price of £476,978. Detached properties sold for an average of £830,587, with terraced properties fetching £397,440.
Overall, the historical sold prices in CM11 over the last year were similar to the previous year and 4% down on the 2022 peak of £608,786.
Properties Sold
6, Patricia Gardens, Billericay CM11 2QR
| Today | See what it's worth now |
| 1 Apr 2026 | £450,000 |
| 22 Oct 2012 | £200,000 |
No other historical records.
89, Norsey Road, Billericay CM11 1BU
| Today | See what it's worth now |
| 30 Mar 2026 | £500,000 |
No other historical records.
80, Salesbury Drive, Billericay CM11 2JH
| Today | See what it's worth now |
| 30 Mar 2026 | £347,500 |
| 1 Dec 2017 | £262,500 |
No other historical records.
Extensions and planning permission in CM11
See planning approval stats, extension build costs and value added estimates.

17, Gascoigne Way, Billericay CM11 2JL
| Today | See what it's worth now |
| 27 Mar 2026 | £410,000 |
| 18 Oct 2017 | £350,000 |
36, Outwood Farm Road, Billericay CM11 2NB
| Today | See what it's worth now |
| 24 Mar 2026 | £427,500 |
| 3 Sep 2020 | £357,500 |
64, Downham Road, Ramsden Heath, Billericay CM11 1PZ
| Today | See what it's worth now |
| 20 Mar 2026 | £980,000 |
| 20 Oct 2005 | £665,000 |
No other historical records.
55, Hollyford, Billericay CM11 1EG
| Today | See what it's worth now |
| 19 Mar 2026 | £418,500 |
| 21 Oct 2016 | £343,000 |
12, Feering Road, Billericay CM11 2DR
| Today | See what it's worth now |
| 19 Mar 2026 | £630,000 |
| 25 Nov 2021 | £570,000 |
38, Grange Road, Billericay CM11 2RG
| Today | See what it's worth now |
| 19 Mar 2026 | £345,000 |
No other historical records.
54, Norton Place, Ramsden Heath, Billericay CM11 1JJ
| Today | See what it's worth now |
| 16 Mar 2026 | £500,000 |
| 22 Mar 2021 | £435,000 |
148, Salesbury Drive, Billericay CM11 2JN
| Today | See what it's worth now |
| 13 Mar 2026 | £430,000 |
| 15 Dec 2014 | £245,000 |
27, Froden Brook, Billericay CM11 2TW
| Today | See what it's worth now |
| 12 Mar 2026 | £375,000 |
| 5 Jul 2019 | £290,000 |
66, Hollyford, Billericay CM11 1EH
| Today | See what it's worth now |
| 12 Mar 2026 | £515,000 |
| 23 Sep 2020 | £390,000 |
3, Hatfield Drive, Billericay CM11 2NQ
| Today | See what it's worth now |
| 3 Mar 2026 | £320,000 |
| 27 Aug 1999 | £85,000 |
55, School Road, Downham, Billericay CM11 1QP

| Today | See what it's worth now |
| 3 Mar 2026 | £690,000 |
| 18 Oct 2022 | £661,250 |
9, Martingale Road, Billericay CM11 1SG
| Today | See what it's worth now |
| 26 Feb 2026 | £925,000 |
| 27 Feb 2015 | £475,000 |
No other historical records.
19, The Meadow Way, Billericay CM11 2HL
| Today | See what it's worth now |
| 20 Feb 2026 | £530,000 |
| 4 Jul 2008 | £275,000 |
12, Coulter Mews, Billericay CM11 1LN
| Today | See what it's worth now |
| 20 Feb 2026 | £830,000 |
| 11 Dec 2015 | £615,000 |
80, Meadow Rise, Billericay CM11 2EF
| Today | See what it's worth now |
| 6 Feb 2026 | £400,000 |
| 11 Dec 2015 | £290,000 |
No other historical records.
1a, Crown Road, Billericay CM11 2AE
| Today | See what it's worth now |
| 6 Feb 2026 | £365,000 |
| 24 Nov 2006 | £221,200 |
No other historical records.
38, Outwood Common Road, Billericay CM11 2NU
| Today | See what it's worth now |
| 5 Feb 2026 | £567,500 |
| 16 Mar 2018 | £360,000 |
No other historical records.
105, Passingham Avenue, Billericay CM11 2TB
| Today | See what it's worth now |
| 30 Jan 2026 | £455,000 |
| 28 Nov 2016 | £313,000 |
39, Mill Road, Billericay CM11 2SF
| Today | See what it's worth now |
| 30 Jan 2026 | £533,000 |
| 2 Jun 2006 | £217,500 |
No other historical records.
Source Acknowledgement: © Crown copyright. England and Wales house price data is publicly available information produced by the HM Land Registry.This material was last updated on 9 July 2026. It covers the period from 1 January 1995 to 30 April 2026 and contains property transactions which have been registered during that period. Contains HM Land Registry data © Crown copyright and database right 2026. This data is licensed under the Open Government Licence v3.0.
Disclaimer: Rightmove.co.uk provides this HM Land Registry data "as is". The burden for fitness of the data relies completely with the user and is provided for informational purposes only. No warranty, express or implied, is given relating to the accuracy of content of the HM Land Registry data and Rightmove does not accept any liability for error or omission. If you have found an error with the data or need further information please contact HM Land Registry.
Permitted Use: Viewers of this Information are granted permission to access this Crown copyright material and to download it onto electronic, magnetic, optical or similar storage media provided that such activities are for private research, study or in-house use only. Any other use of the material requires the formal written permission of Land Registry which can be requested from us, and is subject to an additional licence and associated charge.
Rightmove takes no liability for your use of, or reliance on, Rightmove's Instant Valuation due to the limitations of our tracking tool listed here. Use of this tool is taken entirely at your own risk. All rights reserved.