
House Prices in CW11
House prices in CW11 have an overall average of £305,567 over the last year.
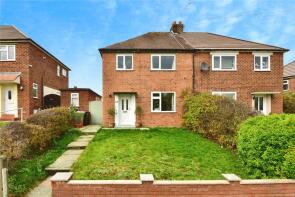
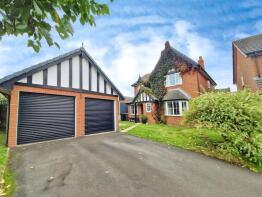
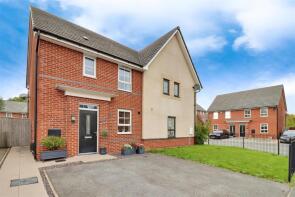
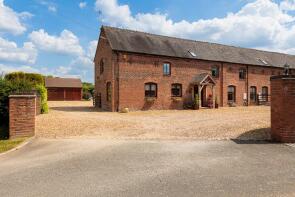
The majority of properties sold in CW11 during the last year were detached properties, selling for an average price of £419,221. Semi-detached properties sold for an average of £262,441, with terraced properties fetching £205,436.
Overall, the historical sold prices in CW11 over the last year were 2% down on the previous year and 1% up on the 2022 peak of £301,437.
Properties Sold
15, Coldmoss Drive, Sandbach CW11 4HW

| Today | See what it's worth now |
| 24 Apr 2026 | £235,000 |
| 17 Mar 2006 | £167,000 |
No other historical records.
1, Old Hall Cottages, High Street, Sandbach CW11 1AL
| Today | See what it's worth now |
| 22 Apr 2026 | £186,500 |
| 21 Aug 2012 | £155,000 |
44, Vicarage Lane, Sandbach CW11 3BU
| Today | See what it's worth now |
| 20 Apr 2026 | £385,000 |
| 18 Dec 2020 | £305,000 |
Extensions and planning permission in CW11
See planning approval stats, extension build costs and value added estimates.

9, Meadow Brown Place, Sandbach CW11 4AT
| Today | See what it's worth now |
| 10 Apr 2026 | £267,500 |
| 29 Apr 2020 | £227,995 |
No other historical records.
85, Elton Road, Sandbach CW11 3NF
| Today | See what it's worth now |
| 9 Apr 2026 | £180,000 |
| 18 Aug 2016 | £124,000 |
176, Middlewich Road, Sandbach CW11 1JD
| Today | See what it's worth now |
| 8 Apr 2026 | £585,000 |
| 26 Feb 2025 | £392,500 |
20, New Street, Sandbach CW11 3JF
| Today | See what it's worth now |
| 2 Apr 2026 | £185,000 |
| 4 May 2007 | £122,000 |
17, Summer Drive, Sandbach CW11 4EJ
| Today | See what it's worth now |
| 31 Mar 2026 | £118,000 |
No other historical records.
35, The Spinney, Sandbach CW11 1FF
| Today | See what it's worth now |
| 27 Mar 2026 | £233,500 |
| 11 Aug 2017 | £160,000 |
10, New Street, Sandbach CW11 3JF
| Today | See what it's worth now |
| 23 Mar 2026 | £191,000 |
| 10 Sep 2004 | £95,000 |
No other historical records.
7, Ringlet Place, Sandbach CW11 4AN

| Today | See what it's worth now |
| 20 Mar 2026 | £366,000 |
| 23 Jul 2021 | £319,995 |
No other historical records.
204, Middlewich Road, Sandbach CW11 1EH
| Today | See what it's worth now |
| 20 Mar 2026 | £360,000 |
| 26 Sep 2019 | £275,000 |
38, Price Close, Sandbach CW11 3JY
| Today | See what it's worth now |
| 20 Mar 2026 | £127,500 |
No other historical records.
48, Charles Barnett Road, Winterley CW11 4TT
| Today | See what it's worth now |
| 18 Mar 2026 | £118,800 |
No other historical records.
54, Elworth Street, Sandbach CW11 1HA
| Today | See what it's worth now |
| 18 Mar 2026 | £205,000 |
| 24 Aug 2023 | £182,000 |
43, Townfields, Sandbach CW11 4PH
| Today | See what it's worth now |
| 17 Mar 2026 | £207,000 |
| 17 Dec 2024 | £200,000 |
25, Oldfield Road, Sandbach CW11 3LW
| Today | See what it's worth now |
| 13 Mar 2026 | £290,000 |
| 27 Aug 2021 | £176,000 |
No other historical records.
13, Meadow Brown Place, Sandbach CW11 4AT

| Today | See what it's worth now |
| 12 Mar 2026 | £285,000 |
| 31 Jul 2020 | £244,995 |
No other historical records.
6, Linden Court, Sandbach CW11 3RU
| Today | See what it's worth now |
| 10 Mar 2026 | £425,000 |
| 11 Aug 1997 | £119,950 |
No other historical records.
11, Moss Lane, Sandbach CW11 3JN

| Today | See what it's worth now |
| 9 Mar 2026 | £250,500 |
| 18 Sep 2009 | £150,000 |
27, Filter Bed Way, Sandbach CW11 4AD
| Today | See what it's worth now |
| 9 Mar 2026 | £267,500 |
| 28 Jun 2018 | £191,995 |
No other historical records.
16, Browning Close, Sandbach CW11 3ZH
| Today | See what it's worth now |
| 6 Mar 2026 | £340,000 |
| 18 Oct 2019 | £250,000 |
The Wheel House, Brindley Grange Farm, Holmes Chapel Road, Sandbach CW11 1SD
| Today | See what it's worth now |
| 6 Mar 2026 | £800,000 |
| 25 Jul 2007 | £499,500 |
No other historical records.
Source Acknowledgement: © Crown copyright. England and Wales house price data is publicly available information produced by the HM Land Registry.This material was last updated on 9 July 2026. It covers the period from 1 January 1995 to 30 April 2026 and contains property transactions which have been registered during that period. Contains HM Land Registry data © Crown copyright and database right 2026. This data is licensed under the Open Government Licence v3.0.
Disclaimer: Rightmove.co.uk provides this HM Land Registry data "as is". The burden for fitness of the data relies completely with the user and is provided for informational purposes only. No warranty, express or implied, is given relating to the accuracy of content of the HM Land Registry data and Rightmove does not accept any liability for error or omission. If you have found an error with the data or need further information please contact HM Land Registry.
Permitted Use: Viewers of this Information are granted permission to access this Crown copyright material and to download it onto electronic, magnetic, optical or similar storage media provided that such activities are for private research, study or in-house use only. Any other use of the material requires the formal written permission of Land Registry which can be requested from us, and is subject to an additional licence and associated charge.
Rightmove takes no liability for your use of, or reliance on, Rightmove's Instant Valuation due to the limitations of our tracking tool listed here. Use of this tool is taken entirely at your own risk. All rights reserved.