
House Prices in Calcot Row
House prices in Calcot Row have an overall average of £366,632 over the last year.
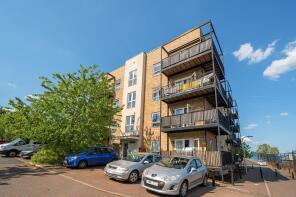
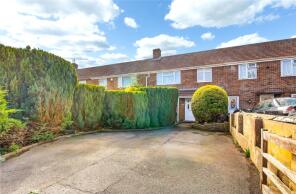
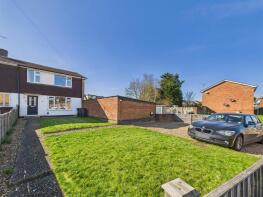
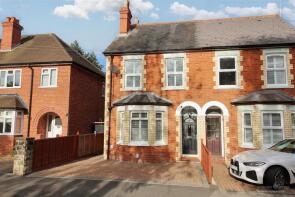
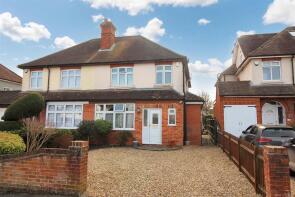
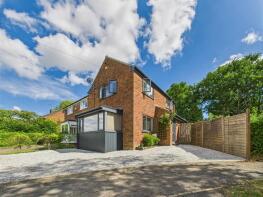
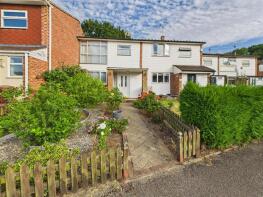
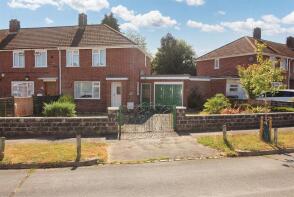
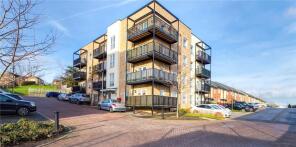
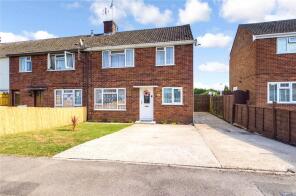
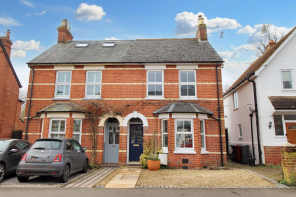
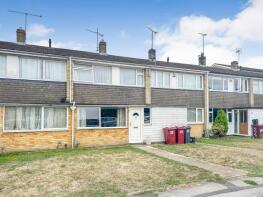
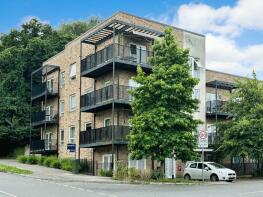
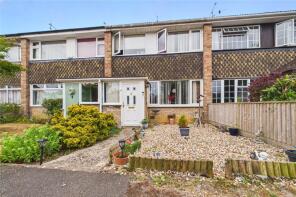
The majority of properties sold in Calcot Row during the last year were terraced properties, selling for an average price of £347,034. Semi-detached properties sold for an average of £420,320, with flats fetching £199,300.
Overall, the historical sold prices in Calcot Row over the last year were 11% down on the previous year and 5% down on the 2022 peak of £385,387.
Properties Sold
Flat 10, 109, Tay Road, Tilehurst, Reading RG30 4ER
| Today | See what it's worth now |
| 14 Apr 2026 | £220,000 |
No other historical records.
19, Ash Road, Tilehurst, Reading RG30 4SG
| Today | See what it's worth now |
| 27 Mar 2026 | £365,000 |
| 4 Jul 2007 | £199,950 |
No other historical records.
91, Corwen Road, Tilehurst, Reading RG30 4ST
| Today | See what it's worth now |
| 27 Mar 2026 | £417,500 |
| 8 Jun 2016 | £297,500 |
No other historical records.
25, Recreation Road, Tilehurst, Reading RG30 4UB
| Today | See what it's worth now |
| 27 Mar 2026 | £400,000 |
| 13 Jan 2006 | £180,100 |
108, Mayfair, Tilehurst, Reading RG30 4RD
| Today | See what it's worth now |
| 23 Mar 2026 | £398,000 |
| 24 Jan 2014 | £238,000 |
Flat 5, 1, Tay Road, Tilehurst, Reading RG30 4DR

| Today | See what it's worth now |
| 5 Mar 2026 | £175,000 |
| 29 Jul 2011 | £134,950 |
No other historical records.
38, Warnford Road, Tilehurst, Reading RG30 4LD
| Today | See what it's worth now |
| 20 Feb 2026 | £415,000 |
No other historical records.
4, Grafton Road, Tilehurst, Reading RG30 4QJ
| Today | See what it's worth now |
| 6 Feb 2026 | £475,000 |
| 11 Apr 2023 | £450,000 |
36, Warnford Road, Tilehurst, Reading RG30 4LA
| Today | See what it's worth now |
| 28 Jan 2026 | £400,000 |
No other historical records.
5, Royston Close, Tilehurst, Reading RG30 4LE
| Today | See what it's worth now |
| 27 Jan 2026 | £380,000 |
| 22 Feb 2002 | £120,000 |
15, Lingholm Close, Tilehurst, Reading RG30 4JS
| Today | See what it's worth now |
| 19 Jan 2026 | £385,000 |
| 21 May 2004 | £198,000 |
51, Usk Road, Tilehurst, Reading RG30 4HR
| Today | See what it's worth now |
| 9 Jan 2026 | £325,000 |
No other historical records.
61, Usk Road, Tilehurst, Reading RG30 4HR
| Today | See what it's worth now |
| 9 Jan 2026 | £345,000 |
No other historical records.
19, Wendover Way, Tilehurst, Reading RG30 4RU
| Today | See what it's worth now |
| 6 Jan 2026 | £545,000 |
| 30 Jun 2000 | £189,950 |
108, Severn Way, Tilehurst, Reading RG30 4HH
| Today | See what it's worth now |
| 19 Dec 2025 | £395,000 |
| 12 Feb 2016 | £220,000 |
110, Severn Way, Tilehurst, Reading RG30 4HH
| Today | See what it's worth now |
| 19 Dec 2025 | £315,000 |
| 20 Aug 2001 | £129,950 |
No other historical records.
41, Chichester Road, Tilehurst, Reading RG30 4XN
| Today | See what it's worth now |
| 19 Dec 2025 | £345,000 |
No other historical records.
28, Grafton Road, Tilehurst, Reading RG30 4QJ
| Today | See what it's worth now |
| 19 Dec 2025 | £340,000 |
No other historical records.
Flat 14, 96 Red Kite House, Deveron Drive, Tilehurst, Reading RG30 4ET
| Today | See what it's worth now |
| 18 Dec 2025 | £185,000 |
| 7 Aug 2020 | £165,000 |
22, Corwen Road, Tilehurst, Reading RG30 4SJ
| Today | See what it's worth now |
| 17 Dec 2025 | £365,000 |
| 10 Dec 2020 | £325,000 |
14, Recreation Road, Tilehurst, Reading RG30 4UA
| Today | See what it's worth now |
| 16 Dec 2025 | £465,000 |
| 11 Sep 2017 | £350,000 |
No other historical records.
20, Taff Way, Tilehurst, Reading RG30 4BA
| Today | See what it's worth now |
| 12 Dec 2025 | £225,000 |
No other historical records.
28, Combe Road, Tilehurst, Reading RG30 4NE
| Today | See what it's worth now |
| 11 Dec 2025 | £315,000 |
| 3 Mar 2020 | £264,000 |
Source Acknowledgement: © Crown copyright. England and Wales house price data is publicly available information produced by the HM Land Registry.This material was last updated on 9 July 2026. It covers the period from 1 January 1995 to 30 April 2026 and contains property transactions which have been registered during that period. Contains HM Land Registry data © Crown copyright and database right 2026. This data is licensed under the Open Government Licence v3.0.
Disclaimer: Rightmove.co.uk provides this HM Land Registry data "as is". The burden for fitness of the data relies completely with the user and is provided for informational purposes only. No warranty, express or implied, is given relating to the accuracy of content of the HM Land Registry data and Rightmove does not accept any liability for error or omission. If you have found an error with the data or need further information please contact HM Land Registry.
Permitted Use: Viewers of this Information are granted permission to access this Crown copyright material and to download it onto electronic, magnetic, optical or similar storage media provided that such activities are for private research, study or in-house use only. Any other use of the material requires the formal written permission of Land Registry which can be requested from us, and is subject to an additional licence and associated charge.
Rightmove takes no liability for your use of, or reliance on, Rightmove's Instant Valuation due to the limitations of our tracking tool listed here. Use of this tool is taken entirely at your own risk. All rights reserved.