
House Prices in Canniesburn
House prices in Canniesburn have an overall average of £397,369 over the last year.
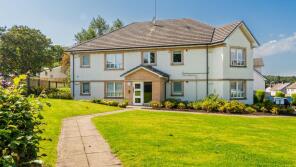
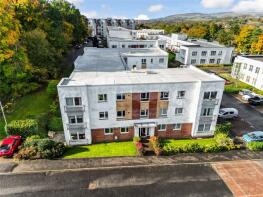
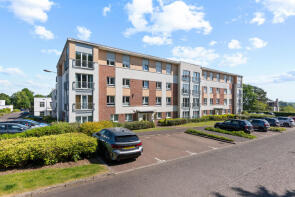
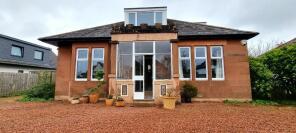
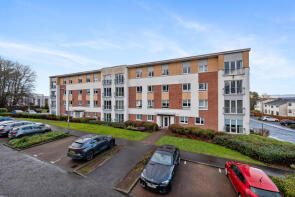
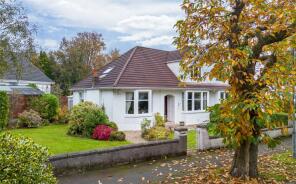
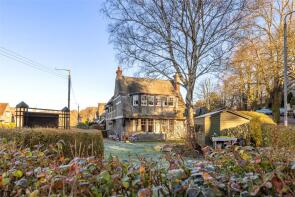
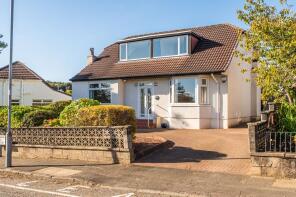
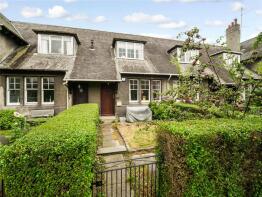
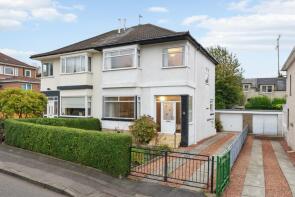
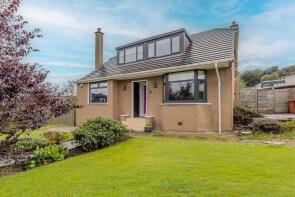
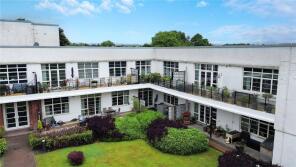
The majority of properties sold in Canniesburn during the last year were detached properties, selling for an average price of £603,021. Semi-detached properties sold for an average of £368,024, with flats fetching £256,857.
Overall, the historical sold prices in Canniesburn over the last year were 14% up on the previous year and 14% up on the 2023 peak of £347,134.
Properties Sold
1, Annan Drive, Glasgow G61 1FE
| Today | See what it's worth now |
| 28 Apr 2026 | £210,000 |
| 30 May 2022 | £210,000 |
11, Canniesburn Quadrant, Glasgow G61 1RU
| Today | See what it's worth now |
| 21 Apr 2026 | £270,000 |
| 2 Jul 2021 | £235,168 |
74, Canniesburn Quadrant, Glasgow G61 1RW
| Today | See what it's worth now |
| 2 Apr 2026 | £240,000 |
| 21 Apr 2016 | £198,000 |
17, Lochend Crescent, Glasgow G61 1EA
| Today | See what it's worth now |
| 30 Mar 2026 | £686,500 |
| 28 Oct 2019 | £440,000 |
No other historical records.
36, Canniesburn Quadrant, Glasgow G61 1RW
| Today | See what it's worth now |
| 27 Mar 2026 | £280,000 |
| 2 Nov 2021 | £225,000 |
6, Lochend Drive, Bearsden G61 1EB
| Today | See what it's worth now |
| 20 Mar 2026 | £540,000 |
No other historical records.
25, Kinglas Road, Glasgow G61 1JR

| Today | See what it's worth now |
| 18 Mar 2026 | £272,500 |
| 21 Jan 2015 | £178,000 |
71, Maxwell Avenue, Glasgow G61 1NZ
| Today | See what it's worth now |
| 16 Mar 2026 | £403,000 |
| 29 Jan 2003 | £120,000 |
No other historical records.
40, Switchback Road, Bearsden G61 1AD
| Today | See what it's worth now |
| 10 Mar 2026 | £449,999 |
No other historical records.
16, Falloch Road, Glasgow G61 1LH
| Today | See what it's worth now |
| 2 Mar 2026 | £250,000 |
| 18 Oct 2022 | £199,995 |
14, Deepdene Road, Glasgow G61 1NS
| Today | See what it's worth now |
| 2 Mar 2026 | £379,500 |
| 14 Dec 2005 | £215,000 |
36, Forth Road, Glasgow G61 1JT
| Today | See what it's worth now |
| 25 Feb 2026 | £250,000 |
| 12 Dec 2025 | £245,000 |
52, Fernlea, Glasgow G61 1NB
| Today | See what it's worth now |
| 23 Feb 2026 | £490,123 |
| 20 Jan 2014 | £360,000 |
No other historical records.
23, Stirling Avenue, Bearsden G61 1PD
| Today | See what it's worth now |
| 18 Feb 2026 | £475,500 |
| 13 May 2025 | £225,000 |
No other historical records.
88, Canniesburn Quadrant, Glasgow G61 1RW

| Today | See what it's worth now |
| 16 Feb 2026 | £265,000 |
| 27 Nov 2017 | £170,000 |
21, Balmoral Drive, Bearsden G61 1DJ
| Today | See what it's worth now |
| 10 Feb 2026 | £450,000 |
No other historical records.
87, Fernlea, Glasgow G61 1NE
| Today | See what it's worth now |
| 10 Feb 2026 | £520,000 |
| 19 Oct 2005 | £319,000 |
No other historical records.
4, Spey Road, Glasgow G61 1LA

| Today | See what it's worth now |
| 9 Feb 2026 | £311,113 |
| 23 Feb 2021 | £210,000 |
9, Conon Avenue, Glasgow G61 1EN
| Today | See what it's worth now |
| 27 Jan 2026 | £413,250 |
| 6 May 2015 | £187,009 |
No other historical records.
52, Maxwell Avenue, Glasgow G61 1NZ
| Today | See what it's worth now |
| 19 Jan 2026 | £250,000 |
| 10 Apr 2018 | £234,000 |
3, Monreith Avenue, Bearsden G61 1NL
| Today | See what it's worth now |
| 19 Jan 2026 | £391,000 |
No other historical records.
11, Cairnhill Road, Glasgow G61 1AU
| Today | See what it's worth now |
| 13 Jan 2026 | £605,269 |
| 5 Sep 2014 | £360,000 |
No other historical records.
6, Canniesburn Quadrant, Glasgow G61 1RW
| Today | See what it's worth now |
| 12 Jan 2026 | £240,000 |
| 10 Jan 2017 | £199,000 |
Source Acknowledgement: © Crown copyright. Scottish house price data is publicly available information produced by the Registers of Scotland. Material has been reproduced with the permission of the Keeper of the Registers of Scotland and contains data compiled by Registers of Scotland. For further information, please contact data@ros.gov.uk. Please note the dates shown here relate to the property's registered date not sold date.This material was last updated on 10 July 2026. It covers the period from 8 December 1987 to 30 April 2026 and contains property transactions which have been registered during that period.
Disclaimer: Rightmove.co.uk provides this Registers of Scotland data "as is". The burden for fitness of the data relies completely with the user and is provided for informational purposes only. No warranty, express or implied, is given relating to the accuracy of content of the Registers of Scotland data and Rightmove plc does not accept any liability for error or omission. If you have found an error with the data or need further information please contact data@ros.gov.uk
Permitted Use: The Registers of Scotland allows the reproduction of the data which it provides to Rightmove.co.uk free of charge in any format or medium only for research, private study or for internal circulation within an organisation. This is subject to it being reproduced accurately and not used in a misleading context. The material must be acknowledged as Crown Copyright. You are not allowed to use this information for commercial purposes, nor must you copy, distribute, sell or publish the data in any way. For any other use of this material, please apply to the Registers of Scotland for a licence. You can do this online at www.ros.gov.uk, by email at data@ros.gov.uk or by writing to Business Development, Registers of Scotland, Meadowbank House, 153 London Road, Edinburgh EH8 7AU.
Rightmove takes no liability for your use of, or reliance on, Rightmove's Instant Valuation due to the limitations of our tracking tool listed here. Use of this tool is taken entirely at your own risk. All rights reserved.