
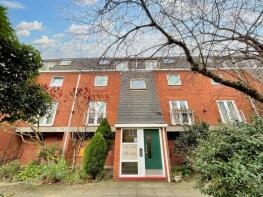
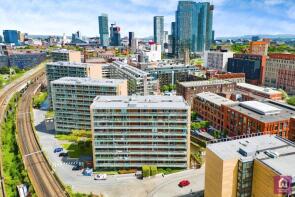
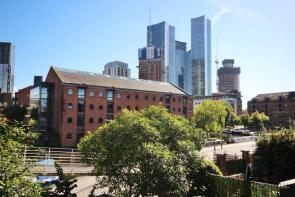
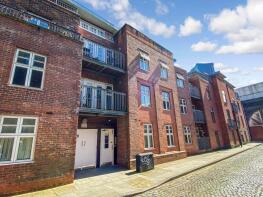
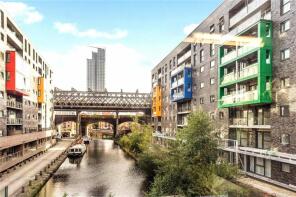
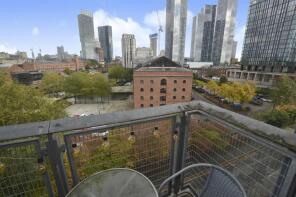
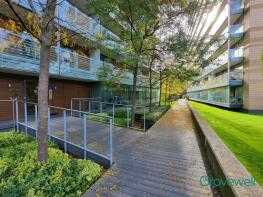
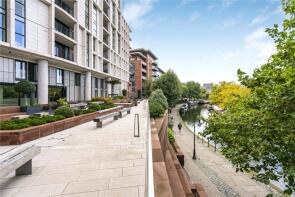
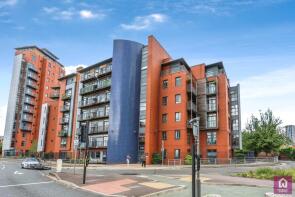
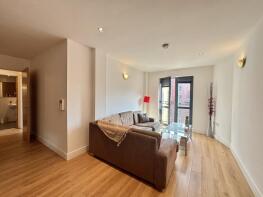
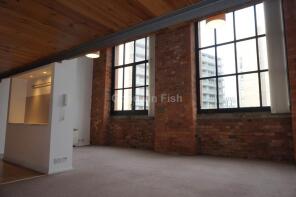
House Prices in Castlefield
House prices in Castlefield have an overall average of £240,932 over the last year.
The majority of properties sold in Castlefield during the last year were flats, selling for an average price of £230,154. Terraced properties sold for an average of £690,000.
Overall, the historical sold prices in Castlefield over the last year were 2% down on the previous year and 23% down on the 2021 peak of £311,941.
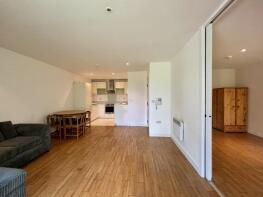
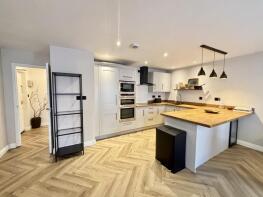
Properties Sold
83, Porchfield Square, Manchester M3 4FG
| Today | See what it's worth now |
| 17 Apr 2026 | £340,000 |
| 30 Nov 2018 | £338,000 |
Flat 316, 4 The Box Works, Worsley Street, Hulme, Manchester M15 4NU

| Today | See what it's worth now |
| 26 Mar 2026 | £250,000 |
| 7 Feb 2019 | £232,500 |
Flat 1006, 2, Little John Street, Manchester M3 3GZ

| Today | See what it's worth now |
| 23 Mar 2026 | £480,000 |
| 10 Apr 2017 | £495,000 |
Flat 319, 3, Kelso Place, Manchester M15 4GS
| Today | See what it's worth now |
| 23 Mar 2026 | £150,000 |
| 13 Feb 2007 | £117,500 |
No other historical records.
117b, Liverpool Road, Manchester M3 4JN
| Today | See what it's worth now |
| 23 Mar 2026 | £260,000 |
| 9 Jul 2021 | £218,500 |
No other historical records.
Flat 2126, 2, Kelso Place, Manchester M15 4GR
| Today | See what it's worth now |
| 17 Mar 2026 | £210,000 |
| 28 Sep 2016 | £193,000 |
Flat 1124, 1, Kelso Place, Manchester M15 4LE

| Today | See what it's worth now |
| 9 Mar 2026 | £172,000 |
| 10 Jun 2015 | £122,000 |
Flat 11, Ship Canal House, Slate Wharf, Manchester M15 4SX
| Today | See what it's worth now |
| 3 Mar 2026 | £200,000 |
| 30 Aug 1996 | £69,995 |
No other historical records.
Flat 52, 4, Barton Street, Manchester M3 4NN
| Today | See what it's worth now |
| 27 Feb 2026 | £172,500 |
| 29 Nov 2005 | £214,500 |
No other historical records.
Flat 309, 43 Wilson Building, Potato Wharf, Manchester M3 4NX
| Today | See what it's worth now |
| 27 Feb 2026 | £198,000 |
| 7 Jun 2022 | £185,725 |
No other historical records.
Apartment 78, 1, Blantyre Street, Manchester M15 4JU
| Today | See what it's worth now |
| 26 Feb 2026 | £175,000 |
| 13 May 2003 | £166,950 |
No other historical records.
Flat 271, 2, Kelso Place, Manchester M15 4GQ

| Today | See what it's worth now |
| 25 Feb 2026 | £175,000 |
| 15 Sep 2017 | £171,500 |
No other historical records.
Flat 302, 3, Kelso Place, Manchester M15 4GS
| Today | See what it's worth now |
| 24 Feb 2026 | £210,000 |
| 13 Jun 2007 | £170,000 |
No other historical records.
Flat 301, 3, Kelso Place, Manchester M15 4GS

| Today | See what it's worth now |
| 24 Feb 2026 | £200,000 |
| 13 Jun 2007 | £170,000 |
No other historical records.
9, Arundel Street, Manchester M15 4JZ
| Today | See what it's worth now |
| 23 Feb 2026 | £395,000 |
No other historical records.
Flat 102, Former St Georges Church, Arundel Street, Manchester M15 4JZ

| Today | See what it's worth now |
| 20 Feb 2026 | £295,000 |
| 16 Aug 2022 | £265,000 |
Flat 32, 62 Mere House, Ellesmere Street, Manchester M15 4QR

| Today | See what it's worth now |
| 20 Feb 2026 | £200,000 |
| 28 Sep 2004 | £198,500 |
No other historical records.
Flat A306, 2a, Chester Road, Manchester M15 4SA
| Today | See what it's worth now |
| 20 Feb 2026 | £262,500 |
| 1 Nov 2021 | £244,800 |
No other historical records.
Apartment 84, 1, Blantyre Street, Manchester M15 4JU
| Today | See what it's worth now |
| 19 Feb 2026 | £212,500 |
| 17 Oct 2016 | £229,000 |
Flat 703, 32 Timber Wharf, Worsley Street, Hulme, Manchester M15 4NZ

| Today | See what it's worth now |
| 19 Feb 2026 | £290,000 |
| 22 Jul 2016 | £235,000 |
Flat 35, 11 Britannia Mills, Hulme Hall Road, Manchester M15 4LA

| Today | See what it's worth now |
| 19 Feb 2026 | £325,000 |
| 13 Dec 2019 | £249,000 |
Flat 49, 62 Mere House, Ellesmere Street, Manchester M15 4QR
| Today | See what it's worth now |
| 16 Feb 2026 | £149,500 |
| 29 Sep 2004 | £147,000 |
No other historical records.
Flat 53, 11 Britannia Mills, Hulme Hall Road, Manchester M15 4LA
| Today | See what it's worth now |
| 12 Feb 2026 | £270,000 |
| 9 Aug 2017 | £210,000 |


Source Acknowledgement: © Crown copyright. England and Wales house price data is publicly available information produced by the HM Land Registry.This material was last updated on 9 July 2026. It covers the period from 1 January 1995 to 30 April 2026 and contains property transactions which have been registered during that period. Contains HM Land Registry data © Crown copyright and database right 2026. This data is licensed under the Open Government Licence v3.0.
Disclaimer: Rightmove.co.uk provides this HM Land Registry data "as is". The burden for fitness of the data relies completely with the user and is provided for informational purposes only. No warranty, express or implied, is given relating to the accuracy of content of the HM Land Registry data and Rightmove does not accept any liability for error or omission. If you have found an error with the data or need further information please contact HM Land Registry.
Permitted Use: Viewers of this Information are granted permission to access this Crown copyright material and to download it onto electronic, magnetic, optical or similar storage media provided that such activities are for private research, study or in-house use only. Any other use of the material requires the formal written permission of Land Registry which can be requested from us, and is subject to an additional licence and associated charge.
Rightmove takes no liability for your use of, or reliance on, Rightmove's Instant Valuation due to the limitations of our tracking tool listed here. Use of this tool is taken entirely at your own risk. All rights reserved.