
House Prices in Chapel Tump
House prices in Chapel Tump have an overall average of £504,328 over the last year.
The majority of properties sold in Chapel Tump during the last year were detached properties, selling for an average price of £546,729. Semi-detached properties sold for an average of £406,400, with terraced properties fetching £220,000.
Overall, the historical sold prices in Chapel Tump over the last year were 9% up on the previous year and 5% up on the 2022 peak of £481,757.
Properties Sold
2, Gamber Head Cottages, B4348 From The Gamber To C1262, Hereford HR2 8JJ

| Today | See what it's worth now |
| 12 Dec 2025 | £150,000 |
| 18 Feb 1997 | £69,000 |
No other historical records.
School House, Bullingham Lane, Hereford HR2 8EB

| Today | See what it's worth now |
| 10 Dec 2025 | £700,000 |
| 23 May 2008 | £295,000 |
Frogwell Cottage, B4348 From C1228 Haywood Road To Mount View, Hereford HR2 8DW

| Today | See what it's worth now |
| 21 Nov 2025 | £682,000 |
| 14 Dec 2016 | £405,000 |
Austena, Little Birch Road, Hereford HR2 8AU
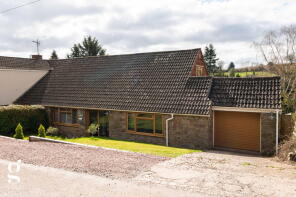
| Today | See what it's worth now |
| 13 Nov 2025 | £395,000 |
| 12 Apr 2018 | £241,100 |
No other historical records.
4, Mount Way, St. Weonards, St Weonards HR2 8NN

| Today | See what it's worth now |
| 23 Oct 2025 | £280,000 |
No other historical records.
The Beeches, C1239 Coed Lank Farm Track To Hazelfield Via Broad Oak, Hereford HR2 8QY

| Today | See what it's worth now |
| 7 Oct 2025 | £560,000 |
| 12 Jul 2007 | £300,000 |
No other historical records.
3, Malferna View, Hereford HR2 8FF
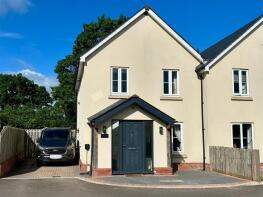
| Today | See what it's worth now |
| 3 Oct 2025 | £330,000 |
| 14 Aug 2020 | £250,000 |
No other historical records.
Old Toll Cottage, B4348 From C1228 Haywood Road To Mount View, Hereford HR2 8DJ

| Today | See what it's worth now |
| 24 Sep 2025 | £300,000 |
| 30 May 2000 | £114,000 |
No other historical records.
Brandon Villa, Ross Road Red Hill, Redhill, Red Hill HR2 8BH

| Today | See what it's worth now |
| 12 Sep 2025 | £375,000 |
| 31 Jan 1996 | £75,000 |
No other historical records.
5, Copper Beeches Close, Hereford HR2 8DX

| Today | See what it's worth now |
| 11 Sep 2025 | £420,000 |
| 10 Sep 2021 | £465,000 |
No other historical records.
3, Southwell Close, Hereford HR2 8DZ

| Today | See what it's worth now |
| 5 Sep 2025 | £645,000 |
| 3 Nov 1995 | £152,500 |
No other historical records.
The Dairy, Great Camdore Farm Barns, C1234 Bagwyllydiart Farm To Little Hill Road, Hereford HR2 8EU
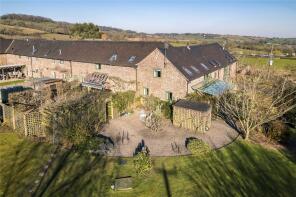
| Today | See what it's worth now |
| 12 Aug 2025 | £645,000 |
| 11 Aug 2017 | £455,000 |
4, Tump Lane, Hereford HR2 8HW
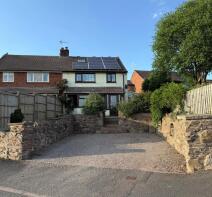
| Today | See what it's worth now |
| 31 Jul 2025 | £270,000 |
| 1 Sep 2021 | £230,000 |
Pipers Pool, C1239 Coed Lank Farm Track To Castlefield Farm, Hereford HR2 8RQ

| Today | See what it's worth now |
| 31 Jul 2025 | £462,500 |
| 5 Nov 2007 | £375,000 |
No other historical records.
Wilf Rose Cottage, C1235 From Orcop Hill To The White House, Hereford HR2 8SD
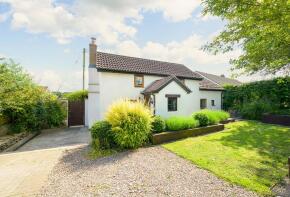
| Today | See what it's worth now |
| 25 Jul 2025 | £395,000 |
| 13 Sep 2021 | £428,750 |
20, Clifton Close, St. Weonards, St Weonards HR2 8FN
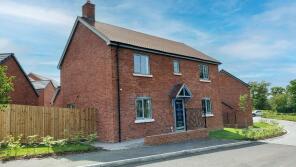
| Today | See what it's worth now |
| 25 Jul 2025 | £550,000 |
No other historical records.
The Barn, Warm Hearth, Callow HR2 8DE
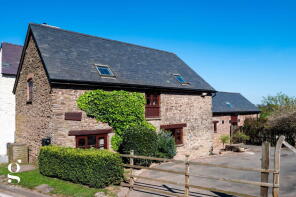
| Today | See what it's worth now |
| 17 Jul 2025 | £635,000 |
| 2 Mar 2012 | £350,000 |
No other historical records.
Byways, Lenastone Lane, Hereford HR2 8JF
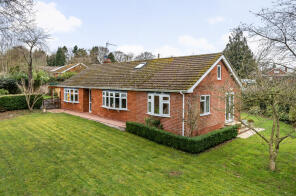
| Today | See what it's worth now |
| 14 Jul 2025 | £697,500 |
| 16 Jun 2000 | £155,000 |
The Swiss Cottage, Wrigglebrook Lane From Cress Cottage To The New House, Hereford HR2 8AW
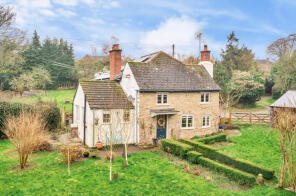
| Today | See what it's worth now |
| 10 Jul 2025 | £554,000 |
| 15 Aug 2014 | £207,500 |
No other historical records.
Fishpool, Fishpool Lane, St. Weonards, St Weonards HR2 8NY
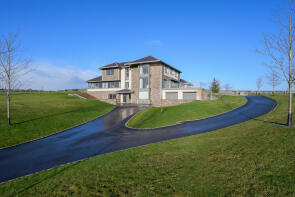
| Today | See what it's worth now |
| 6 Jun 2025 | £1,740,000 |
No other historical records.
3, The Pippins, Much Dewchurch HR2 8DL

| Today | See what it's worth now |
| 28 Apr 2025 | £493,000 |
No other historical records.
Clifton House, A466 From B4521 To Monkton Road, Hereford HR2 8NT

| Today | See what it's worth now |
| 17 Apr 2025 | £400,000 |
No other historical records.
Woodside Cottage, Little Hill Road, Hereford HR2 8SE
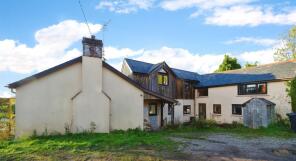
| Today | See what it's worth now |
| 31 Mar 2025 | £450,000 |
| 13 Apr 2017 | £312,500 |
No other historical records.
1, Norton Brook Cottages, Norton Brook Road, Hereford HR2 8ED

| Today | See what it's worth now |
| 31 Mar 2025 | £392,000 |
| 21 Jul 2017 | £258,000 |
No other historical records.
14, Clifton Close, St. Weonards, St Weonards HR2 8FN

| Today | See what it's worth now |
| 31 Mar 2025 | £565,000 |
No other historical records.
Source Acknowledgement: © Crown copyright. England and Wales house price data is publicly available information produced by the HM Land Registry.This material was last updated on 4 February 2026. It covers the period from 1 January 1995 to 24 December 2025 and contains property transactions which have been registered during that period. Contains HM Land Registry data © Crown copyright and database right 2026. This data is licensed under the Open Government Licence v3.0.
Disclaimer: Rightmove.co.uk provides this HM Land Registry data "as is". The burden for fitness of the data relies completely with the user and is provided for informational purposes only. No warranty, express or implied, is given relating to the accuracy of content of the HM Land Registry data and Rightmove does not accept any liability for error or omission. If you have found an error with the data or need further information please contact HM Land Registry.
Permitted Use: Viewers of this Information are granted permission to access this Crown copyright material and to download it onto electronic, magnetic, optical or similar storage media provided that such activities are for private research, study or in-house use only. Any other use of the material requires the formal written permission of Land Registry which can be requested from us, and is subject to an additional licence and associated charge.
Map data ©OpenStreetMap contributors.
Rightmove takes no liability for your use of, or reliance on, Rightmove's Instant Valuation due to the limitations of our tracking tool listed here. Use of this tool is taken entirely at your own risk. All rights reserved.
