
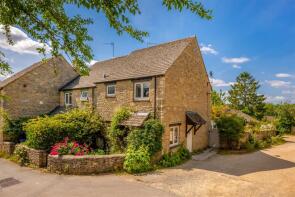
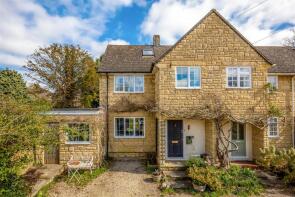
House Prices in Charlbury
House prices in Charlbury have an overall average of £556,298 over the last year.
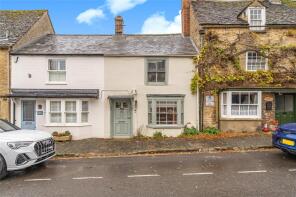
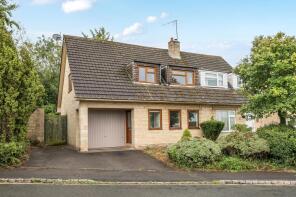
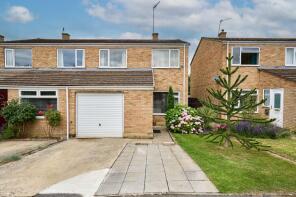
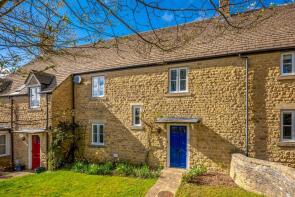
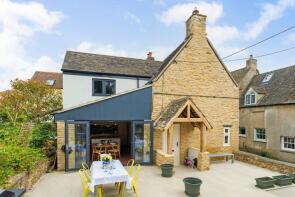
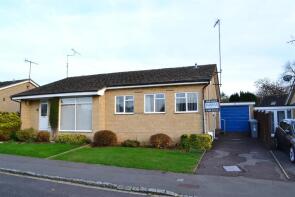
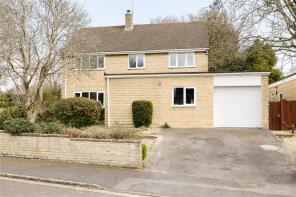
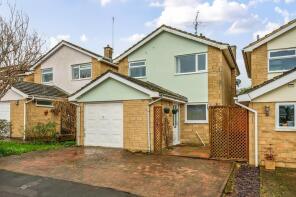
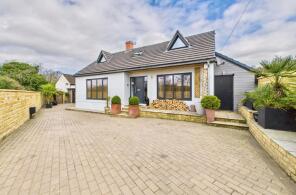
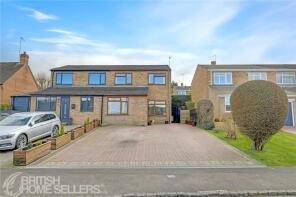
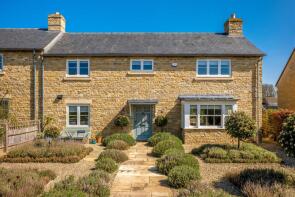
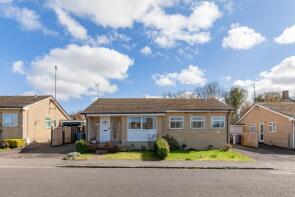
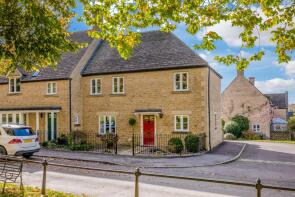
The majority of properties sold in Charlbury during the last year were semi-detached properties, selling for an average price of £510,944. Detached properties sold for an average of £640,625, with terraced properties fetching £647,500.
Overall, the historical sold prices in Charlbury over the last year were 28% down on the previous year and 15% down on the 2023 peak of £654,000.
Properties Sold
Wychwood Cottage, Church Street, Chipping Norton OX7 3PR
| Today | See what it's worth now |
| 25 Mar 2026 | £650,000 |
| 8 Oct 2020 | £470,000 |
Cobwebs, Hixet Wood, Chipping Norton OX7 3SB
| Today | See what it's worth now |
| 3 Mar 2026 | £785,000 |
| 20 Feb 2006 | £460,000 |
17, Sturt Road, Chipping Norton OX7 3SX
| Today | See what it's worth now |
| 20 Feb 2026 | £490,000 |
| 17 Nov 2006 | £220,000 |
No other historical records.
Flat 2, Kingham House, The Slade, Chipping Norton OX7 3SJ
| Today | See what it's worth now |
| 11 Feb 2026 | £330,000 |
| 2 Mar 2021 | £260,000 |
25, Marlborough Place, Chipping Norton OX7 3SH

| Today | See what it's worth now |
| 6 Feb 2026 | £425,000 |
| 7 Dec 2008 | £218,000 |
No other historical records.
40, Nine Acres Close, Chipping Norton OX7 3RB
| Today | See what it's worth now |
| 15 Jan 2026 | £500,000 |
| 31 Oct 2011 | £277,500 |
No other historical records.
31, Marlborough Place, Chipping Norton OX7 3SH
| Today | See what it's worth now |
| 1 Dec 2025 | £415,000 |
| 29 Feb 2012 | £210,000 |
32, The Playing Close, Chipping Norton OX7 3RJ
| Today | See what it's worth now |
| 12 Nov 2025 | £475,000 |
| 1 Nov 2016 | £425,000 |
The Rise, Hixet Wood, Chipping Norton OX7 3SB
| Today | See what it's worth now |
| 10 Oct 2025 | £680,000 |
| 26 Sep 2014 | £322,500 |
Homend Cottage, Pooles Lane, Chipping Norton OX7 3RT
| Today | See what it's worth now |
| 3 Oct 2025 | £476,251 |
| 18 Jun 2001 | £165,000 |
No other historical records.
6, Church Close, Chipping Norton OX7 3PY
| Today | See what it's worth now |
| 3 Oct 2025 | £595,000 |
| 20 Aug 2014 | £341,000 |
8, Wychwood House, Enstone Road, Chipping Norton OX7 3QR
| Today | See what it's worth now |
| 12 Sep 2025 | £320,000 |
| 1 Aug 2014 | £250,000 |
Doggetts, Thames Street, Chipping Norton OX7 3QQ
| Today | See what it's worth now |
| 11 Sep 2025 | £870,000 |
| 11 May 2018 | £620,000 |
22, Elm Crescent, Chipping Norton OX7 3PZ
| Today | See what it's worth now |
| 5 Sep 2025 | £380,000 |
| 18 Mar 2022 | £255,000 |
1, Wychwood Close, Charlbury OX7 3TB
| Today | See what it's worth now |
| 5 Sep 2025 | £837,500 |
| 25 Sep 2015 | £500,000 |
No other historical records.
75, The Green, Chipping Norton OX7 3QB
| Today | See what it's worth now |
| 5 Sep 2025 | £495,000 |
| 4 Sep 2007 | £249,950 |
Wychwood View, Stonesfield Lane, Charlbury OX7 3ER
| Today | See what it's worth now |
| 30 Jul 2025 | £870,000 |
No other historical records.
28, Woodfield Drive, Chipping Norton OX7 3SE
| Today | See what it's worth now |
| 28 Jul 2025 | £412,500 |
| 9 Jun 2006 | £184,000 |
16, Tanners Court, Chipping Norton OX7 3RP
| Today | See what it's worth now |
| 21 Jul 2025 | £401,000 |
| 27 Jul 2000 | £117,500 |
4, Elmstead Court, Pooles Lane, Chipping Norton OX7 3RT
| Today | See what it's worth now |
| 16 Jul 2025 | £895,000 |
| 7 Mar 2018 | £660,000 |
No other historical records.
20, Elm Crescent, Chipping Norton OX7 3PZ
| Today | See what it's worth now |
| 7 Jul 2025 | £380,000 |
| 9 Mar 2018 | £275,000 |
10, The Playing Close, Chipping Norton OX7 3RJ
| Today | See what it's worth now |
| 16 Jun 2025 | £525,000 |
| 16 Apr 1999 | £225,000 |
No other historical records.
1, Graces Court, The Slade, Chipping Norton OX7 3EG
| Today | See what it's worth now |
| 12 Jun 2025 | £922,500 |
| 20 May 2019 | £730,000 |
No other historical records.
Source Acknowledgement: © Crown copyright. England and Wales house price data is publicly available information produced by the HM Land Registry.This material was last updated on 9 July 2026. It covers the period from 1 January 1995 to 30 April 2026 and contains property transactions which have been registered during that period. Contains HM Land Registry data © Crown copyright and database right 2026. This data is licensed under the Open Government Licence v3.0.
Disclaimer: Rightmove.co.uk provides this HM Land Registry data "as is". The burden for fitness of the data relies completely with the user and is provided for informational purposes only. No warranty, express or implied, is given relating to the accuracy of content of the HM Land Registry data and Rightmove does not accept any liability for error or omission. If you have found an error with the data or need further information please contact HM Land Registry.
Permitted Use: Viewers of this Information are granted permission to access this Crown copyright material and to download it onto electronic, magnetic, optical or similar storage media provided that such activities are for private research, study or in-house use only. Any other use of the material requires the formal written permission of Land Registry which can be requested from us, and is subject to an additional licence and associated charge.
Rightmove takes no liability for your use of, or reliance on, Rightmove's Instant Valuation due to the limitations of our tracking tool listed here. Use of this tool is taken entirely at your own risk. All rights reserved.