
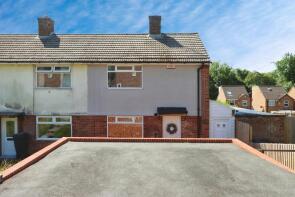
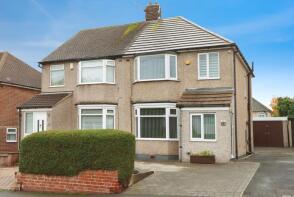
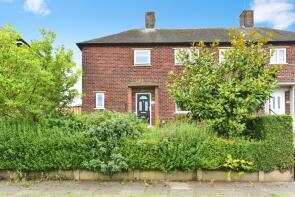
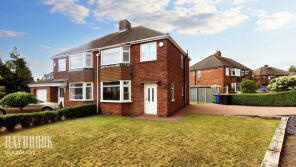
House Prices in Charnock
House prices in Charnock have an overall average of £197,324 over the last year.
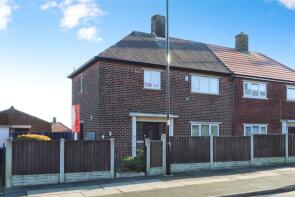
The majority of properties sold in Charnock during the last year were semi-detached properties, selling for an average price of £197,823. Terraced properties sold for an average of £173,625, with flats fetching £110,500.
Overall, the historical sold prices in Charnock over the last year were 9% down on the previous year and 5% down on the 2023 peak of £208,046.
Properties Sold
30, Stoneley Crescent, Sheffield S12 3JH
| Today | See what it's worth now |
| 13 Apr 2026 | £180,000 |
| 6 Apr 2023 | £144,000 |
Flat 9, 1 The White House, White Lane, Gleadless, Sheffield S12 3GD

| Today | See what it's worth now |
| 10 Apr 2026 | £117,500 |
| 19 Oct 2018 | £102,000 |
54, Thornbridge Crescent, Sheffield S12 3AE

| Today | See what it's worth now |
| 2 Apr 2026 | £165,000 |
| 14 Aug 2024 | £145,000 |
No other historical records.
132, Bowman Drive, Sheffield S12 3LH
| Today | See what it's worth now |
| 31 Mar 2026 | £200,000 |
| 14 Feb 2020 | £148,500 |
33, Thornbridge Road, Sheffield S12 3AL
| Today | See what it's worth now |
| 27 Mar 2026 | £170,000 |
No other historical records.
53, Arnold Avenue, Sheffield S12 3JA
| Today | See what it's worth now |
| 19 Mar 2026 | £205,000 |
| 28 May 2021 | £160,000 |
No other historical records.
2, Jaunty View, Sheffield S12 3DY
| Today | See what it's worth now |
| 13 Mar 2026 | £185,000 |
| 19 Aug 2005 | £99,500 |
No other historical records.
43, Charnock Grove, Sheffield S12 3HE
| Today | See what it's worth now |
| 13 Mar 2026 | £260,000 |
| 22 Jul 2016 | £159,000 |
13, Lister Way, Sheffield S12 3FZ
| Today | See what it's worth now |
| 6 Mar 2026 | £170,000 |
| 20 Dec 2019 | £116,000 |
6, Birley Moor Drive, Sheffield S12 3AU
| Today | See what it's worth now |
| 5 Mar 2026 | £182,000 |
| 2 Jul 2021 | £138,000 |
No other historical records.
14, Kew Crescent, Sheffield S12 3LP
| Today | See what it's worth now |
| 27 Feb 2026 | £235,000 |
| 24 Feb 2012 | £118,000 |
28, Thornbridge Way, Sheffield S12 3AP
| Today | See what it's worth now |
| 20 Feb 2026 | £157,000 |
| 26 Oct 2023 | £158,000 |
19, Moorland View, Sheffield S12 3JJ
| Today | See what it's worth now |
| 19 Feb 2026 | £127,500 |
| 26 Jun 2017 | £98,500 |
1, Woodland View, Sheffield S12 3HX
| Today | See what it's worth now |
| 12 Feb 2026 | £226,000 |
| 17 Mar 2006 | £125,000 |
No other historical records.
26, Ribblesdale Drive, Sheffield S12 3XE
| Today | See what it's worth now |
| 6 Feb 2026 | £456,789 |
| 3 Nov 2016 | £300,000 |
No other historical records.
31, Briarfield Road, Sheffield S12 3LD

| Today | See what it's worth now |
| 2 Feb 2026 | £170,000 |
No other historical records.
7, Lister Place, Sheffield S12 3FY
| Today | See what it's worth now |
| 23 Jan 2026 | £240,000 |
| 16 Feb 2024 | £175,000 |
62, Birley Moor Avenue, Sheffield S12 3AR
| Today | See what it's worth now |
| 23 Jan 2026 | £150,000 |
No other historical records.
32, Carter Hall Road, Sheffield S12 3HS
| Today | See what it's worth now |
| 16 Jan 2026 | £220,000 |
| 22 Oct 2010 | £140,000 |
No other historical records.
17, Stoneley Dell, Sheffield S12 3JR

| Today | See what it's worth now |
| 16 Jan 2026 | £355,000 |
| 28 Jul 2020 | £307,000 |
26, Jaunty Place, Sheffield S12 3DS
| Today | See what it's worth now |
| 16 Jan 2026 | £172,500 |
| 16 Dec 2005 | £105,500 |
24, Basegreen Road, Sheffield S12 3FH
| Today | See what it's worth now |
| 16 Jan 2026 | £170,000 |
| 13 Jan 2017 | £115,000 |
61, Thornbridge Road, Sheffield S12 3AN
| Today | See what it's worth now |
| 14 Jan 2026 | £170,000 |
| 14 Oct 2020 | £135,000 |
Source Acknowledgement: © Crown copyright. England and Wales house price data is publicly available information produced by the HM Land Registry.This material was last updated on 9 July 2026. It covers the period from 1 January 1995 to 30 April 2026 and contains property transactions which have been registered during that period. Contains HM Land Registry data © Crown copyright and database right 2026. This data is licensed under the Open Government Licence v3.0.
Disclaimer: Rightmove.co.uk provides this HM Land Registry data "as is". The burden for fitness of the data relies completely with the user and is provided for informational purposes only. No warranty, express or implied, is given relating to the accuracy of content of the HM Land Registry data and Rightmove does not accept any liability for error or omission. If you have found an error with the data or need further information please contact HM Land Registry.
Permitted Use: Viewers of this Information are granted permission to access this Crown copyright material and to download it onto electronic, magnetic, optical or similar storage media provided that such activities are for private research, study or in-house use only. Any other use of the material requires the formal written permission of Land Registry which can be requested from us, and is subject to an additional licence and associated charge.
Rightmove takes no liability for your use of, or reliance on, Rightmove's Instant Valuation due to the limitations of our tracking tool listed here. Use of this tool is taken entirely at your own risk. All rights reserved.