
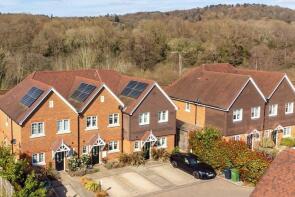
House Prices in Chilworth
House prices in Chilworth have an overall average of £531,017 over the last year.
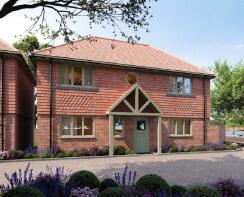
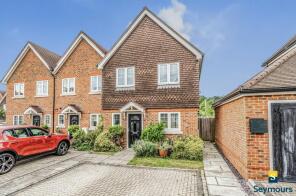
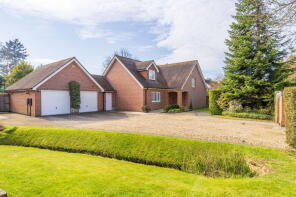
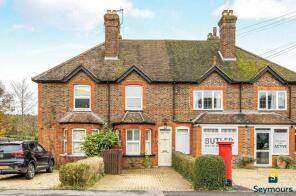
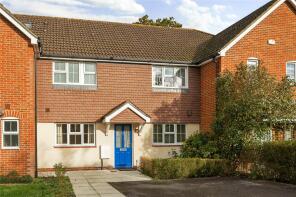
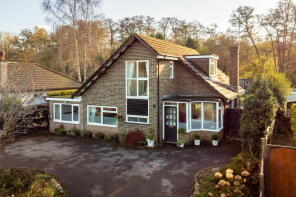
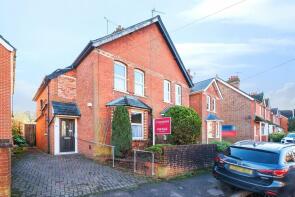
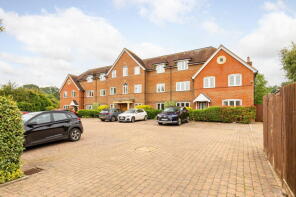
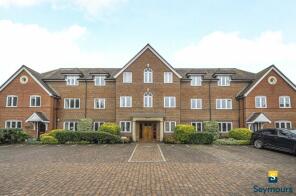
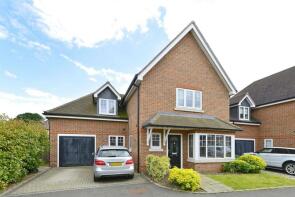
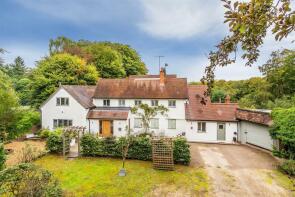
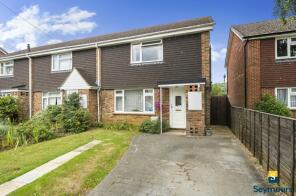
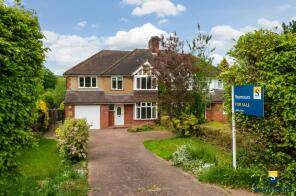
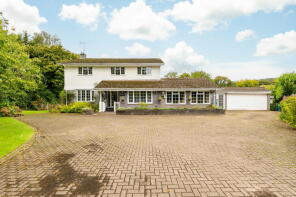
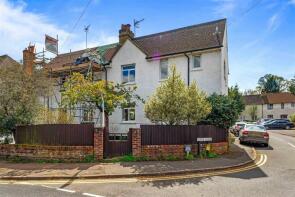
The majority of properties sold in Chilworth during the last year were semi-detached properties, selling for an average price of £447,043. Terraced properties sold for an average of £462,286, with detached properties fetching £956,000.
Overall, the historical sold prices in Chilworth over the last year were 19% down on the previous year and 17% down on the 2023 peak of £637,788.
Properties Sold
14, Alder Grove, Guildford GU4 8FA
| Today | See what it's worth now |
| 16 Dec 2025 | £540,000 |
| 29 Jul 2020 | £465,000 |
No other historical records.
67, Hornhatch, Guildford GU4 8AZ
| Today | See what it's worth now |
| 12 Dec 2025 | £350,000 |
| 14 Feb 2003 | £177,500 |
No other historical records.
128, New Road, Guildford GU4 8LX
| Today | See what it's worth now |
| 5 Dec 2025 | £390,000 |
| 7 Jun 2006 | £250,000 |
No other historical records.
19, Nursery Gardens, Guildford GU4 8PA
| Today | See what it's worth now |
| 7 Nov 2025 | £225,000 |
| 4 Aug 2011 | £225,000 |
No other historical records.
3, Haywards Corner, Dorking Road, Guildford GU4 8BG


| Today | See what it's worth now |
| 27 Oct 2025 | £500,000 |
| 17 Jan 2020 | £465,000 |
126, New Road, Guildford GU4 8LX
| Today | See what it's worth now |
| 6 Oct 2025 | £395,000 |
| 7 Apr 2021 | £365,000 |
9, Chantry Cottages, Chantry Road, Guildford GU4 8LT
| Today | See what it's worth now |
| 29 Aug 2025 | £630,000 |
| 22 Mar 2013 | £288,000 |
20, Nursery Gardens, Guildford GU4 8PA
| Today | See what it's worth now |
| 29 Aug 2025 | £396,000 |
| 12 Mar 2020 | £300,000 |
No other historical records.
90, New Road, Guildford GU4 8LU
| Today | See what it's worth now |
| 30 Jul 2025 | £485,000 |
| 7 Mar 1997 | £87,500 |
No other historical records.
5, Alder Grove, Guildford GU4 8FA
| Today | See what it's worth now |
| 28 Jul 2025 | £520,000 |
| 20 Jul 2018 | £485,000 |
No other historical records.
Herons Brook, Old Manor Lane, Guildford GU4 8NE
| Today | See what it's worth now |
| 11 Jul 2025 | £925,000 |
| 25 Feb 2002 | £225,000 |
No other historical records.
Little Poynetts, Blackheath, Guildford GU4 8RD
| Today | See what it's worth now |
| 9 Jul 2025 | £1,190,000 |
No other historical records.
4a, St Thomas Close, Guildford GU4 8LQ

| Today | See what it's worth now |
| 17 Apr 2025 | £517,500 |
| 30 Jul 2007 | £350,000 |
No other historical records.
78, New Road, Guildford GU4 8LU
| Today | See what it's worth now |
| 31 Mar 2025 | £520,000 |
| 7 Feb 2020 | £356,500 |
No other historical records.
5, St Thomas Close, Guildford GU4 8LQ
| Today | See what it's worth now |
| 28 Mar 2025 | £535,000 |
| 9 Mar 2006 | £325,000 |
No other historical records.
38, Dorking Road, Guildford GU4 8NR
| Today | See what it's worth now |
| 27 Mar 2025 | £753,000 |
| 7 Oct 2019 | £555,000 |
No other historical records.
95, New Road, Chilworth GU4 8LP
| Today | See what it's worth now |
| 24 Mar 2025 | £361,800 |
No other historical records.
Flat 10, Surrey House, New Road, Guildford GU4 8LP
| Today | See what it's worth now |
| 21 Mar 2025 | £325,000 |
| 26 Oct 2020 | £287,500 |
Flat 5, Surrey House, New Road, Guildford GU4 8LP
| Today | See what it's worth now |
| 28 Feb 2025 | £315,000 |
| 25 Mar 2022 | £300,000 |
8, Alder Grove, Guildford GU4 8FA
| Today | See what it's worth now |
| 21 Feb 2025 | £830,000 |
| 11 Jul 2018 | £660,000 |
No other historical records.
Aston Cottage, Blackheath, Guildford GU4 8RD
| Today | See what it's worth now |
| 14 Feb 2025 | £1,825,000 |
| 9 Apr 2014 | £1,200,000 |
No other historical records.
9, Hornhatch, Guildford GU4 8AY
| Today | See what it's worth now |
| 12 Feb 2025 | £430,000 |
| 28 Feb 2013 | £195,000 |
No other historical records.
176, New Road, Guildford GU4 8LX
| Today | See what it's worth now |
| 4 Feb 2025 | £620,000 |
| 18 Jan 2008 | £320,000 |
No other historical records.
Alderbrook House, Redwood Grove, Chilworth GU4 8NU
| Today | See what it's worth now |
| 31 Jan 2025 | £1,200,000 |
No other historical records.
125, New Road, Guildford GU4 8LZ
| Today | See what it's worth now |
| 27 Sep 2024 | £500,000 |
| 28 Apr 2023 | £465,000 |
Source Acknowledgement: © Crown copyright. England and Wales house price data is publicly available information produced by the HM Land Registry.This material was last updated on 4 February 2026. It covers the period from 1 January 1995 to 24 December 2025 and contains property transactions which have been registered during that period. Contains HM Land Registry data © Crown copyright and database right 2026. This data is licensed under the Open Government Licence v3.0.
Disclaimer: Rightmove.co.uk provides this HM Land Registry data "as is". The burden for fitness of the data relies completely with the user and is provided for informational purposes only. No warranty, express or implied, is given relating to the accuracy of content of the HM Land Registry data and Rightmove does not accept any liability for error or omission. If you have found an error with the data or need further information please contact HM Land Registry.
Permitted Use: Viewers of this Information are granted permission to access this Crown copyright material and to download it onto electronic, magnetic, optical or similar storage media provided that such activities are for private research, study or in-house use only. Any other use of the material requires the formal written permission of Land Registry which can be requested from us, and is subject to an additional licence and associated charge.
Map data ©OpenStreetMap contributors.
Rightmove takes no liability for your use of, or reliance on, Rightmove's Instant Valuation due to the limitations of our tracking tool listed here. Use of this tool is taken entirely at your own risk. All rights reserved.