
House Prices in Shalford
House prices in Shalford have an overall average of £722,728 over the last year.
The majority of properties sold in Shalford during the last year were detached properties, selling for an average price of £1,007,491. Terraced properties sold for an average of £464,750, with semi-detached properties fetching £542,778.
Overall, the historical sold prices in Shalford over the last year were 2% down on the previous year and 9% down on the 2022 peak of £793,627.
Properties Sold
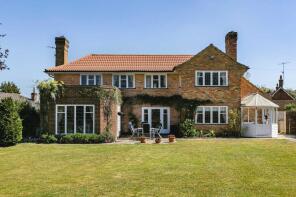
7, Poplar Road, Shalford GU4 8DH
| Today | See today's value |
| 12 Aug 2026 | £1,050,000 |
No other historical records.
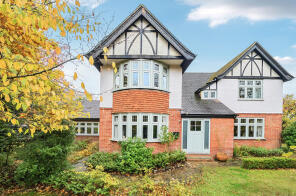
1, Orchard Road, Guildford GU4 8ER
| Today | See today's value |
| 10 Aug 2026 | £1,093,000 |
| 3 Mar 2017 | £735,000 |
No other historical records.
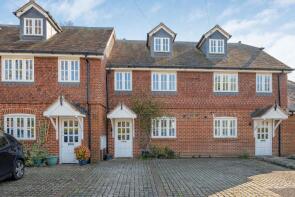
3, Brook Green, Horsham Road, Guildford GU4 8EG
| Today | See today's value |
| 3 Aug 2026 | £670,000 |
| 29 Jun 2021 | £620,000 |
5a, Oakford Mews, Station Road, Shalford GU4 8HU
| Today | See today's value |
| 24 Jul 2026 | £625,000 |
No other historical records.
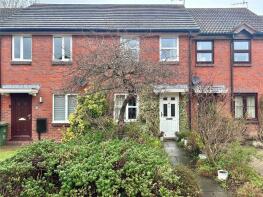
12, Weald Close, Shalford GU4 8HX
| Today | See today's value |
| 24 Jul 2026 | £400,000 |
No other historical records.
32, Summersbury Drive, Shalford GU4 8JQ
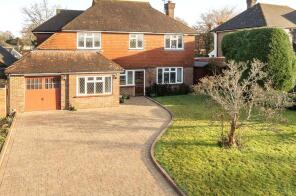
| Today | See today's value |
| 22 Jul 2026 | £1,094,000 |
No other historical records.
Farriers, Chinthurst Lane, Shalford, Guildford GU4 8JR
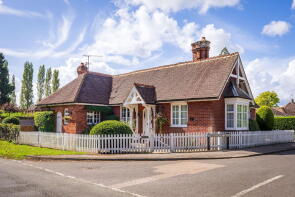
| Today | See today's value |
| 15 Jul 2026 | £740,000 |
No other historical records.
Coach House, Christmas Hill, Guildford GU4 8HP
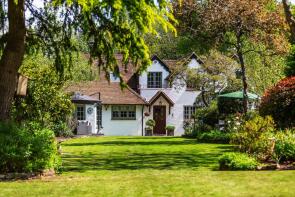
| Today | See today's value |
| 14 Jul 2026 | £1,630,000 |
| 10 Oct 2008 | £730,000 |
14, Kings Road, Guildford GU4 8JU
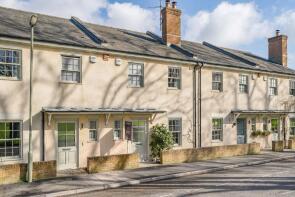
| Today | See today's value |
| 3 Jul 2026 | £620,000 |
| 14 Aug 2015 | £470,000 |
No other historical records.
5, Weald Close, Shalford GU4 8HX
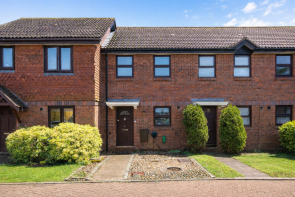
| Today | See today's value |
| 1 Jul 2026 | £415,000 |
No other historical records.
Flat 3, Denbigh House, Horsham Road, Guildford GU4 8EJ

| Today | See today's value |
| 18 Jun 2026 | £320,000 |
| 27 Feb 2020 | £290,000 |
2, Wey Cottages, Broadford, Guildford GU4 8DS
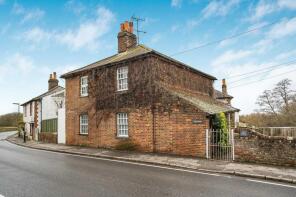
| Today | See today's value |
| 29 May 2026 | £365,000 |
| 16 Nov 2021 | £355,000 |
11, Mitchells Close, Guildford GU4 8HY
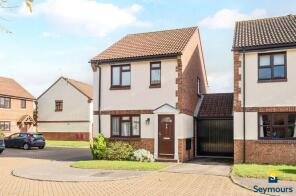
| Today | See today's value |
| 29 May 2026 | £490,000 |
| 26 Jul 1996 | £100,000 |
No other historical records.
29, Dagden Road, Guildford GU4 8DD
| Today | See today's value |
| 28 May 2026 | £460,337 |
| 18 Oct 2001 | £570,000 |
No other historical records.
3, Little Orchard Way, Shalford GU4 8JY
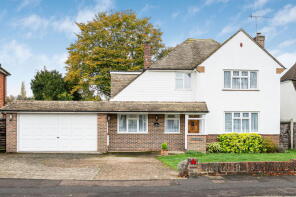
| Today | See today's value |
| 29 Apr 2026 | £900,000 |
No other historical records.
8, Woodbine Cottages, The Common, Guildford GU4 8JF
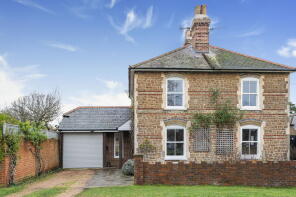
| Today | See today's value |
| 29 Apr 2026 | £810,000 |
| 2 May 2017 | £640,000 |
No other historical records.
Advent House, Chinthurst Lane, Guildford GU4 8JS
| Today | See today's value |
| 29 Apr 2026 | £1,600,000 |
| 18 Jan 2011 | £1,225,000 |
1, Rose Cottages, Horsham Road, Guildford GU4 8DQ

| Today | See today's value |
| 13 Mar 2026 | £600,000 |
| 22 Jul 2011 | £350,000 |
No other historical records.
10, Juniper Place, Shalford Common, Guildford GU4 8DA
| Today | See today's value |
| 17 Feb 2026 | £440,000 |
| 26 Jul 2005 | £250,000 |
3, Juniper Terrace, Juniper Place, Shalford Common, Guildford GU4 8BX
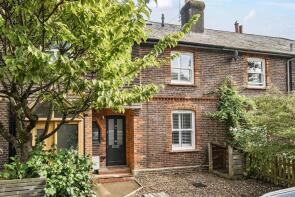
| Today | See today's value |
| 16 Feb 2026 | £620,000 |
| 10 May 2004 | £140,000 |
No other historical records.
Waverley, Somerswey, Shalford GU4 8EQ

| Today | See today's value |
| 12 Feb 2026 | £815,000 |
No other historical records.
115, Tillingbourne Road, Guildford GU4 8ET

| Today | See today's value |
| 30 Jan 2026 | £430,000 |
| 15 May 2015 | £310,000 |
No other historical records.
Morland, Broadford, Shalford GU4 8DR

| Today | See today's value |
| 30 Jan 2026 | £515,000 |
No other historical records.


Rightmove takes no liability for your use of, or reliance on, Rightmove's Instant Valuation due to the limitations of our tracking tool listed here. Use of this tool is taken entirely at your own risk. All rights reserved.