
House Prices in Chinnor
House prices in Chinnor have an overall average of £506,706 over the last year.
The majority of properties sold in Chinnor during the last year were detached properties, selling for an average price of £636,982. Semi-detached properties sold for an average of £446,515, with terraced properties fetching £414,275.
Overall, the historical sold prices in Chinnor over the last year were 2% up on the previous year and 4% down on the 2022 peak of £528,157.
Properties Sold
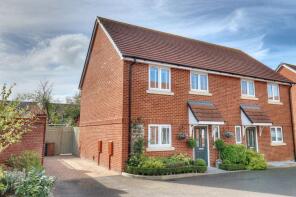
34, Emperor Way, Chinnor OX39 4GL
| Today | See what it's worth now |
| 13 Apr 2026 | £527,000 |
| 27 Jun 2024 | £550,000 |
No other historical records.
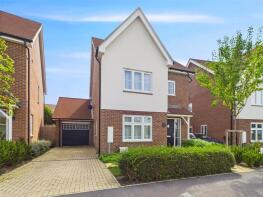
10, Braken Road, Chinnor OX39 4FU
| Today | See what it's worth now |
| 1 Apr 2026 | £615,000 |
| 12 Feb 2021 | £560,000 |
No other historical records.
11, Lummas Mead, Chinnor OX39 4FQ
| Today | See what it's worth now |
| 31 Mar 2026 | £807,000 |
| 18 Oct 2019 | £662,000 |
No other historical records.
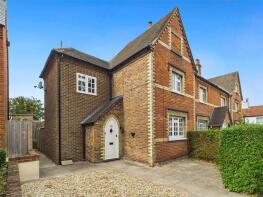
6, Hill Farm Court, Chinnor OX39 4NX
| Today | See what it's worth now |
| 30 Mar 2026 | £385,000 |
| 19 Aug 2011 | £330,000 |
6, Orchard Way, Chinnor OX39 4UD
| Today | See what it's worth now |
| 18 Mar 2026 | £283,333 |
No other historical records.
9, Emperor Way, Chinnor OX39 4GL
| Today | See what it's worth now |
| 17 Mar 2026 | £432,500 |
| 20 Dec 2022 | £440,000 |
No other historical records.
1 Badger Cottage, Keens Lane, Chinnor OX39 4PF
| Today | See what it's worth now |
| 13 Mar 2026 | £375,000 |
| 24 Sep 2010 | £240,000 |
4, Hillwerke, Chinnor OX39 4TX
| Today | See what it's worth now |
| 26 Feb 2026 | £450,000 |
| 3 Aug 2001 | £162,000 |
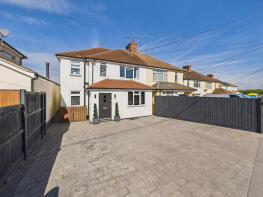
22, Greenwood Avenue, Chinnor OX39 4HN
| Today | See what it's worth now |
| 17 Feb 2026 | £475,000 |
| 5 Jan 2018 | £410,000 |
No other historical records.
9, Cherry Tree Road, Chinnor OX39 4QY
| Today | See what it's worth now |
| 13 Feb 2026 | £400,000 |
No other historical records.
8, Conigre, Chinnor OX39 4JY

| Today | See what it's worth now |
| 11 Feb 2026 | £390,000 |
| 25 Apr 2023 | £375,000 |
9 Croft Cottage, Lower Road, Chinnor OX39 4DT
| Today | See what it's worth now |
| 6 Feb 2026 | £360,000 |
| 10 Feb 2020 | £320,000 |
6, Ashridge, Chinnor OX39 4JU
| Today | See what it's worth now |
| 2 Feb 2026 | £550,000 |
| 7 Aug 2020 | £360,000 |
4, Walnut Tree Close, Chinnor OX39 4FH
| Today | See what it's worth now |
| 30 Jan 2026 | £550,000 |
| 21 Apr 2017 | £480,000 |
No other historical records.
1, Hawthorn Close, Chinnor OX39 4GD
| Today | See what it's worth now |
| 23 Jan 2026 | £430,000 |
| 28 Jun 2019 | £350,000 |
No other historical records.
3, Appletree Grove, Chinnor OX39 4AU
| Today | See what it's worth now |
| 16 Jan 2026 | £670,000 |
No other historical records.
19, Rushland Field, Chinnor OX39 4FZ
| Today | See what it's worth now |
| 15 Jan 2026 | £570,000 |
| 21 Sep 2021 | £500,000 |
No other historical records.
64, High Street, Chinnor OX39 4DH
| Today | See what it's worth now |
| 12 Jan 2026 | £370,000 |
| 6 Sep 2013 | £250,000 |
No other historical records.
23, Wykeham Rise, Chinnor OX39 4PS
| Today | See what it's worth now |
| 15 Dec 2025 | £600,000 |
| 2 Dec 2020 | £525,000 |
11, Oakley Lane, Chinnor OX39 4HT
| Today | See what it's worth now |
| 12 Dec 2025 | £637,500 |
| 6 Feb 2015 | £400,000 |
No other historical records.
13, Malyns Close, Chinnor OX39 4EW
| Today | See what it's worth now |
| 12 Dec 2025 | £430,000 |
| 8 Jun 2018 | £370,000 |
27, Rushland Field, Chinnor OX39 4FZ
| Today | See what it's worth now |
| 12 Dec 2025 | £660,000 |
| 28 Jun 2021 | £630,000 |
No other historical records.
9, Church Lane, Chinnor OX39 4PW
| Today | See what it's worth now |
| 12 Dec 2025 | £875,000 |
| 21 Sep 2011 | £283,000 |
No other historical records.

Source Acknowledgement: © Crown copyright. England and Wales house price data is publicly available information produced by the HM Land Registry.This material was last updated on 9 July 2026. It covers the period from 1 January 1995 to 30 April 2026 and contains property transactions which have been registered during that period. Contains HM Land Registry data © Crown copyright and database right 2026. This data is licensed under the Open Government Licence v3.0.
Disclaimer: Rightmove.co.uk provides this HM Land Registry data "as is". The burden for fitness of the data relies completely with the user and is provided for informational purposes only. No warranty, express or implied, is given relating to the accuracy of content of the HM Land Registry data and Rightmove does not accept any liability for error or omission. If you have found an error with the data or need further information please contact HM Land Registry.
Permitted Use: Viewers of this Information are granted permission to access this Crown copyright material and to download it onto electronic, magnetic, optical or similar storage media provided that such activities are for private research, study or in-house use only. Any other use of the material requires the formal written permission of Land Registry which can be requested from us, and is subject to an additional licence and associated charge.
Rightmove takes no liability for your use of, or reliance on, Rightmove's Instant Valuation due to the limitations of our tracking tool listed here. Use of this tool is taken entirely at your own risk. All rights reserved.