
House Prices in Chipstead Bottom
House prices in Chipstead Bottom have an overall average of £1,235,044 over the last year.
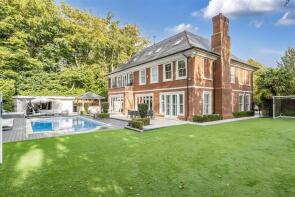
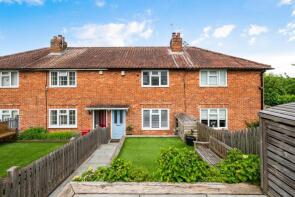
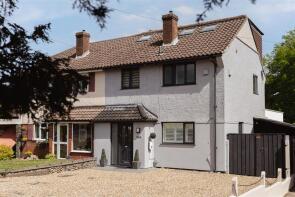
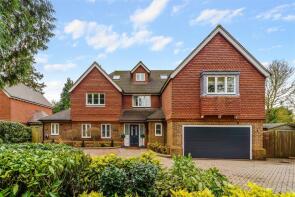
The majority of properties sold in Chipstead Bottom during the last year were detached properties, selling for an average price of £1,802,105. Semi-detached properties sold for an average of £498,583, with flats fetching £505,833.
Overall, the historical sold prices in Chipstead Bottom over the last year were 24% up on the previous year and 15% up on the 2022 peak of £1,071,925.
Properties Sold
12, Maybury Close, Tadworth KT20 6BZ
| Today | See what it's worth now |
| 19 Mar 2026 | £400,000 |
| 19 Aug 2004 | £199,950 |
No other historical records.
Bramhall, Forest Drive, Kingswood KT20 6LN
| Today | See what it's worth now |
| 10 Mar 2026 | £1,230,000 |
No other historical records.
31, Green Lane, Lower Kingswood KT20 6TB
| Today | See what it's worth now |
| 16 Feb 2026 | £700,000 |
No other historical records.
Flat 12, 4, Waterhouse Lane, Tadworth KT20 6EB
| Today | See what it's worth now |
| 8 Jan 2026 | £395,000 |
| 26 Nov 2014 | £410,000 |
No other historical records.
Wynwood House, Warren Drive, Tadworth KT20 6PY
| Today | See what it's worth now |
| 22 Dec 2025 | £3,000,000 |
| 17 Jun 2013 | £2,550,000 |
No other historical records.
45, Beechen Lane, Tadworth KT20 6RY
| Today | See what it's worth now |
| 17 Dec 2025 | £470,000 |
| 12 Sep 2014 | £293,000 |
Dalmeny, Outwood Lane, Tadworth KT20 6JW
| Today | See what it's worth now |
| 12 Dec 2025 | £685,000 |
| 19 Aug 2002 | £380,000 |
No other historical records.
Jardin Cottage, Copleigh Drive, Tadworth KT20 6BJ
| Today | See what it's worth now |
| 5 Dec 2025 | £650,000 |
| 24 Apr 2012 | £400,000 |
No other historical records.
The Annexe, Kingswood House, Eyhurst Close, Kingswood KT20 6NR
| Today | See what it's worth now |
| 21 Nov 2025 | £700,000 |
No other historical records.
Flat 24, Kingswood Grange, Babylon Lane, Tadworth KT20 6UY
| Today | See what it's worth now |
| 7 Nov 2025 | £500,000 |
| 28 Jun 2021 | £500,000 |
Woodlands, Warren Drive, Tadworth KT20 6PX
| Today | See what it's worth now |
| 6 Nov 2025 | £2,900,000 |
| 24 Jul 2014 | £850,000 |
Flat 5, Long Orchards, Copt Hill Lane, Tadworth KT20 6HN
| Today | See what it's worth now |
| 4 Nov 2025 | £487,500 |
| 11 May 2007 | £399,950 |
No other historical records.
52, Canons Lane, Burgh Heath KT20 6DP

| Today | See what it's worth now |
| 24 Oct 2025 | £425,000 |
No other historical records.
54, Beechen Lane, Tadworth KT20 6RU
| Today | See what it's worth now |
| 24 Oct 2025 | £405,000 |
| 18 Apr 2024 | £545,000 |
6, Manor Place, Tadworth KT20 6AE

| Today | See what it's worth now |
| 10 Oct 2025 | £850,000 |
| 29 Jul 2020 | £873,000 |
Flat 16, Tudor Lodge, St Monicas Road, Tadworth KT20 6EX
| Today | See what it's worth now |
| 10 Oct 2025 | £785,000 |
| 19 Apr 2002 | £490,000 |
26, Green Lane, Tadworth KT20 6TL

| Today | See what it's worth now |
| 17 Sep 2025 | £860,000 |
| 3 May 2006 | £370,000 |
Tressady, Brighton Road, Tadworth KT20 6UP
| Today | See what it's worth now |
| 5 Sep 2025 | £568,000 |
| 14 Dec 2012 | £262,500 |
No other historical records.
Ruffett House, Cedar Walk, Kingswood KT20 6HW
| Today | See what it's worth now |
| 29 Aug 2025 | £1,700,000 |
| 30 Jun 2004 | £870,000 |
No other historical records.
Flat 1, Oakdene, The Glade, Tadworth KT20 6LL
| Today | See what it's worth now |
| 31 Jul 2025 | £600,000 |
| 19 Dec 2006 | £395,000 |
No other historical records.
1, Warren Cottages, Waterhouse Lane, Tadworth KT20 6LB
| Today | See what it's worth now |
| 31 Jul 2025 | £645,000 |
| 3 May 1996 | £171,000 |
No other historical records.
6, Tealby Close, Tadworth KT20 6AX
| Today | See what it's worth now |
| 30 Jul 2025 | £512,500 |
| 6 Dec 2021 | £502,000 |
22, Green Lane, Tadworth KT20 6TB
| Today | See what it's worth now |
| 28 Jul 2025 | £1,105,000 |
| 16 Jun 2017 | £540,000 |
Source Acknowledgement: © Crown copyright. England and Wales house price data is publicly available information produced by the HM Land Registry.This material was last updated on 15 May 2026. It covers the period from 1 January 1995 to 31 March 2026 and contains property transactions which have been registered during that period. Contains HM Land Registry data © Crown copyright and database right 2026. This data is licensed under the Open Government Licence v3.0.
Disclaimer: Rightmove.co.uk provides this HM Land Registry data "as is". The burden for fitness of the data relies completely with the user and is provided for informational purposes only. No warranty, express or implied, is given relating to the accuracy of content of the HM Land Registry data and Rightmove does not accept any liability for error or omission. If you have found an error with the data or need further information please contact HM Land Registry.
Permitted Use: Viewers of this Information are granted permission to access this Crown copyright material and to download it onto electronic, magnetic, optical or similar storage media provided that such activities are for private research, study or in-house use only. Any other use of the material requires the formal written permission of Land Registry which can be requested from us, and is subject to an additional licence and associated charge.
Map data ©OpenStreetMap contributors.
Rightmove takes no liability for your use of, or reliance on, Rightmove's Instant Valuation due to the limitations of our tracking tool listed here. Use of this tool is taken entirely at your own risk. All rights reserved.