
House Prices in Chorley
House prices in Chorley have an overall average of £214,259 over the last year.
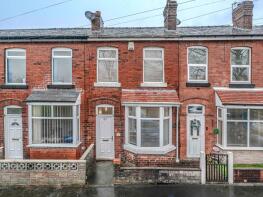
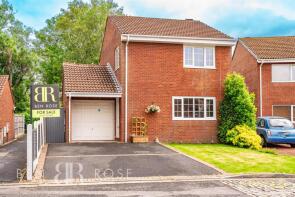
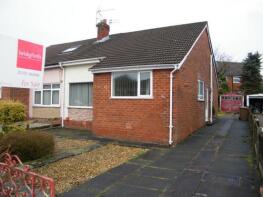
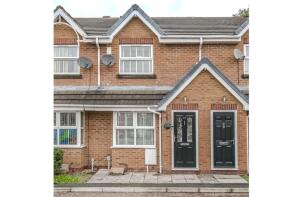
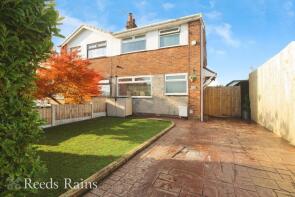
The majority of properties sold in Chorley during the last year were terraced properties, selling for an average price of £156,764. Semi-detached properties sold for an average of £217,819, with detached properties fetching £346,088.
Overall, the historical sold prices in Chorley over the last year were 4% up on the previous year and 6% up on the 2023 peak of £201,946.
Properties Sold
57, Draperfield, Chorley PR7 3PL

| Today | See what it's worth now |
| 21 Apr 2026 | £174,000 |
| 31 Mar 2022 | £130,000 |
30, Kershaw Street, Chorley PR6 0BG
| Today | See what it's worth now |
| 14 Apr 2026 | £129,995 |
| 6 Nov 2006 | £85,500 |
Hill Cot, Bolton Road, Chorley PR7 4AJ
| Today | See what it's worth now |
| 10 Apr 2026 | £350,000 |
| 26 Apr 2022 | £355,000 |
62, Duxbury Manor Way, Chorley PR7 3FJ

| Today | See what it's worth now |
| 10 Apr 2026 | £520,000 |
| 7 Mar 2019 | £380,000 |
48, Wymundsley, Chorley PR7 1UT
| Today | See what it's worth now |
| 8 Apr 2026 | £265,000 |
| 17 May 2006 | £155,000 |
21, Austin Drive, Chorley PR7 3DF
| Today | See what it's worth now |
| 7 Apr 2026 | £360,000 |
| 13 Dec 2011 | £249,995 |
No other historical records.
22, Bolton Road, Chorley PR7 3ES
| Today | See what it's worth now |
| 2 Apr 2026 | £136,995 |
| 16 Feb 2001 | £32,000 |
No other historical records.
26, Harrison Road, Chorley PR7 3HP
| Today | See what it's worth now |
| 2 Apr 2026 | £142,000 |
| 11 Jan 2019 | £105,000 |
3, Glenisland Close, Chorley PR7 3FX
| Today | See what it's worth now |
| 2 Apr 2026 | £257,000 |
| 21 Oct 2022 | £230,000 |
No other historical records.
29, Ash Grove, Chorley PR7 3HZ
| Today | See what it's worth now |
| 31 Mar 2026 | £177,000 |
| 7 Sep 2009 | £120,000 |
94, Collingwood Road, Chorley PR7 2PT
| Today | See what it's worth now |
| 30 Mar 2026 | £125,000 |
| 26 Nov 2020 | £125,000 |
No other historical records.
11, St Josephs Place, Chorley PR6 0NE
| Today | See what it's worth now |
| 27 Mar 2026 | £162,000 |
| 19 Oct 2023 | £127,500 |
20, Kensington Road, Chorley PR7 1LU
| Today | See what it's worth now |
| 27 Mar 2026 | £156,000 |
| 11 Feb 2005 | £173,000 |
No other historical records.
73, Montcliffe Road, Chorley PR6 0EN
| Today | See what it's worth now |
| 27 Mar 2026 | £255,000 |
| 15 Feb 2017 | £152,950 |
No other historical records.
54, Grey Heights View, Chorley PR6 0TN

| Today | See what it's worth now |
| 27 Mar 2026 | £311,850 |
| 4 Mar 2016 | £220,000 |
19, Woodchat Court, Chorley PR7 2RF
| Today | See what it's worth now |
| 27 Mar 2026 | £138,500 |
| 21 Jan 2022 | £105,000 |
23, Primrose Street, Chorley PR6 0AE
| Today | See what it's worth now |
| 27 Mar 2026 | £128,000 |
| 15 Jun 2007 | £93,000 |
11, Foxcote, Chorley PR7 1XE

| Today | See what it's worth now |
| 27 Mar 2026 | £260,000 |
| 12 Jun 2020 | £175,000 |
No other historical records.
17, Amber Drive, Chorley PR6 0LA
| Today | See what it's worth now |
| 27 Mar 2026 | £390,000 |
| 25 Apr 2003 | £164,950 |
No other historical records.
87 Windyridge, Harpers Lane, Chorley PR6 0HR
| Today | See what it's worth now |
| 27 Mar 2026 | £200,000 |
| 14 Aug 2020 | £187,000 |
19, Letchworth Place, Chorley PR7 2HJ

| Today | See what it's worth now |
| 27 Mar 2026 | £174,500 |
| 27 Jan 2023 | £155,000 |
104, Cowling Brow, Chorley PR6 0QG
| Today | See what it's worth now |
| 26 Mar 2026 | £142,000 |
| 4 Jun 2004 | £74,500 |
No other historical records.
1, Holly House, Denham Wood Close, Chorley PR7 2WG
| Today | See what it's worth now |
| 24 Mar 2026 | £105,000 |
| 24 May 2004 | £103,450 |
No other historical records.
Source Acknowledgement: © Crown copyright. England and Wales house price data is publicly available information produced by the HM Land Registry.This material was last updated on 9 July 2026. It covers the period from 1 January 1995 to 30 April 2026 and contains property transactions which have been registered during that period. Contains HM Land Registry data © Crown copyright and database right 2026. This data is licensed under the Open Government Licence v3.0.
Disclaimer: Rightmove.co.uk provides this HM Land Registry data "as is". The burden for fitness of the data relies completely with the user and is provided for informational purposes only. No warranty, express or implied, is given relating to the accuracy of content of the HM Land Registry data and Rightmove does not accept any liability for error or omission. If you have found an error with the data or need further information please contact HM Land Registry.
Permitted Use: Viewers of this Information are granted permission to access this Crown copyright material and to download it onto electronic, magnetic, optical or similar storage media provided that such activities are for private research, study or in-house use only. Any other use of the material requires the formal written permission of Land Registry which can be requested from us, and is subject to an additional licence and associated charge.
Rightmove takes no liability for your use of, or reliance on, Rightmove's Instant Valuation due to the limitations of our tracking tool listed here. Use of this tool is taken entirely at your own risk. All rights reserved.