
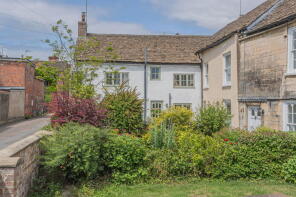
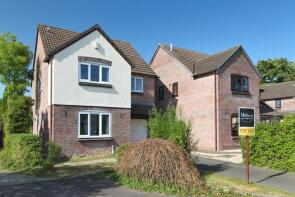
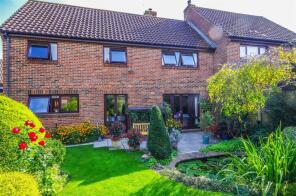
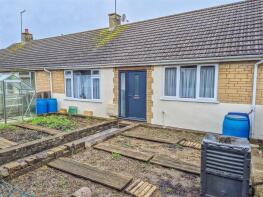
House Prices in Churchend
House prices in Churchend have an overall average of £446,330 over the last year.
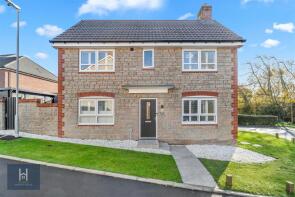
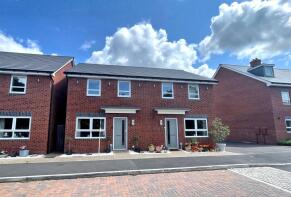
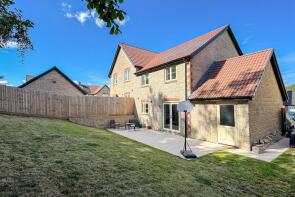
The majority of properties sold in Churchend during the last year were detached properties, selling for an average price of £549,044. Semi-detached properties sold for an average of £383,140, with terraced properties fetching £310,250.
Overall, the historical sold prices in Churchend over the last year were 7% up on the previous year and 5% down on the 2022 peak of £470,730.
Properties Sold
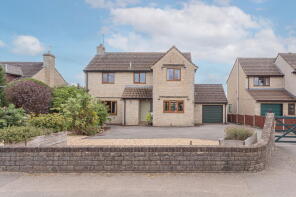
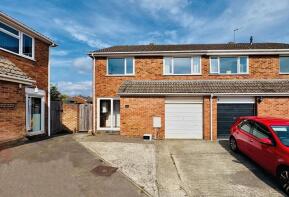
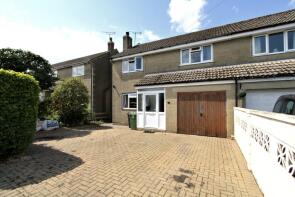
Aspen House, Wickwar Road, Wotton-under-edge GL12 8RF
| Today | See what it's worth now |
| 20 Apr 2026 | £620,000 |
| 1 Nov 2007 | £400,000 |
No other historical records.
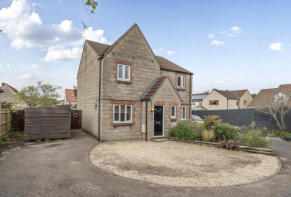
3, The Burltons, Wotton-under-edge GL12 8BH
| Today | See what it's worth now |
| 17 Apr 2026 | £220,000 |
| 28 Nov 2018 | £170,000 |
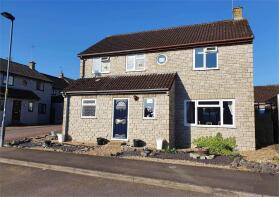
11, Cranesbill Crescent, Wotton-under-edge GL12 8EH

| Today | See what it's worth now |
| 23 Mar 2026 | £490,000 |
| 3 Oct 2017 | £425,000 |
No other historical records.
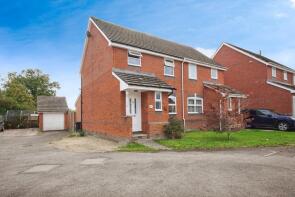
64, Inglestone Road, Wotton-under-edge GL12 8NH
| Today | See what it's worth now |
| 20 Mar 2026 | £450,000 |
| 28 Mar 2025 | £425,000 |
93, Woodlands Road, Wotton-under-edge GL12 8LT
| Today | See what it's worth now |
| 20 Mar 2026 | £340,000 |
| 29 Apr 2002 | £127,000 |
11, Thames Close, Wotton-under-edge GL12 8UA
| Today | See what it's worth now |
| 13 Mar 2026 | £310,000 |
| 31 Mar 2017 | £222,500 |
No other historical records.
Apartment 3, 36 Arnolds Court, High Street, Wotton-under-edge GL12 8NP
| Today | See what it's worth now |
| 12 Mar 2026 | £309,350 |
| 17 Oct 2014 | £270,000 |
No other historical records.
18, Durham Road, Wotton-under-edge GL12 8TH

| Today | See what it's worth now |
| 12 Mar 2026 | £336,000 |
| 23 Aug 1996 | £66,000 |
No other historical records.
Bibstone House, Bristol Road, Wotton-under-edge GL12 8AD

| Today | See what it's worth now |
| 11 Mar 2026 | £740,000 |
| 25 Aug 2000 | £250,000 |
No other historical records.
27, Poskett Way, Wotton-under-edge GL12 8FF
| Today | See what it's worth now |
| 9 Mar 2026 | £395,000 |
| 17 Dec 2021 | £339,995 |
No other historical records.
9, Abbey Street, Wotton-under-edge GL12 8RN
| Today | See what it's worth now |
| 9 Mar 2026 | £330,000 |
| 30 Jun 1998 | £75,000 |
No other historical records.
32, Walkmill Lane, Wotton-under-edge GL12 8RZ
| Today | See what it's worth now |
| 2 Mar 2026 | £340,000 |
| 15 Aug 2008 | £235,000 |
15, Selman Drive, Wotton-under-edge GL12 8FJ
| Today | See what it's worth now |
| 24 Feb 2026 | £530,000 |
| 30 Jun 2022 | £489,995 |
No other historical records.
Hill Cottage, Westend Road, Wotton-under-edge GL12 8JZ
| Today | See what it's worth now |
| 13 Feb 2026 | £380,000 |
| 18 Dec 2019 | £265,000 |
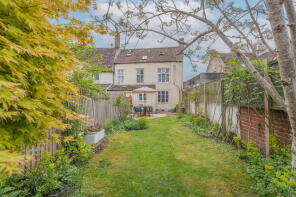
17, High Street, Wotton-under-edge GL12 8RS
| Today | See what it's worth now |
| 12 Feb 2026 | £295,000 |
| 31 Aug 1995 | £62,800 |
No other historical records.
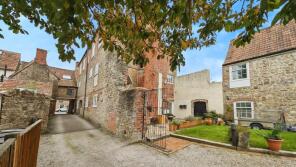
The Grange, Duck Street, Wotton-under-edge GL12 8QB
| Today | See what it's worth now |
| 23 Jan 2026 | £1,575,000 |
| 30 Jun 2021 | £1,375,000 |
No other historical records.
21, High Street, Wotton-under-edge GL12 8NE
| Today | See what it's worth now |
| 19 Dec 2025 | £315,000 |
| 28 Jul 2020 | £225,000 |
98, Poskett Way, Charfield GL12 8FG
| Today | See what it's worth now |
| 5 Dec 2025 | £76,000 |
No other historical records.
11, Abbey Street, Wotton-under-edge GL12 8RN
| Today | See what it's worth now |
| 1 Dec 2025 | £220,000 |
| 26 May 2023 | £200,000 |
5, Watermill Close, Wotton-under-edge GL12 8BW
| Today | See what it's worth now |
| 28 Nov 2025 | £365,000 |
| 7 Sep 2005 | £215,000 |
16, Poskett Way, Wotton-under-edge GL12 8FG
| Today | See what it's worth now |
| 28 Nov 2025 | £330,000 |
| 13 May 2022 | £331,995 |
No other historical records.
19, Clements Way, Tytherington GL12 8FT
| Today | See what it's worth now |
| 28 Nov 2025 | £455,000 |
| 26 May 2023 | £480,000 |
No other historical records.
17, Bramley Close, Wotton-under-edge GL12 8SF
| Today | See what it's worth now |
| 27 Nov 2025 | £478,000 |
| 22 Nov 1996 | £95,000 |
No other historical records.
Source Acknowledgement: © Crown copyright. England and Wales house price data is publicly available information produced by the HM Land Registry.This material was last updated on 9 July 2026. It covers the period from 1 January 1995 to 30 April 2026 and contains property transactions which have been registered during that period. Contains HM Land Registry data © Crown copyright and database right 2026. This data is licensed under the Open Government Licence v3.0.
Disclaimer: Rightmove.co.uk provides this HM Land Registry data "as is". The burden for fitness of the data relies completely with the user and is provided for informational purposes only. No warranty, express or implied, is given relating to the accuracy of content of the HM Land Registry data and Rightmove does not accept any liability for error or omission. If you have found an error with the data or need further information please contact HM Land Registry.
Permitted Use: Viewers of this Information are granted permission to access this Crown copyright material and to download it onto electronic, magnetic, optical or similar storage media provided that such activities are for private research, study or in-house use only. Any other use of the material requires the formal written permission of Land Registry which can be requested from us, and is subject to an additional licence and associated charge.
Rightmove takes no liability for your use of, or reliance on, Rightmove's Instant Valuation due to the limitations of our tracking tool listed here. Use of this tool is taken entirely at your own risk. All rights reserved.