
House Prices in Clarke Ind Est
House prices in Clarke Ind Est have an overall average of £285,760 over the last year.
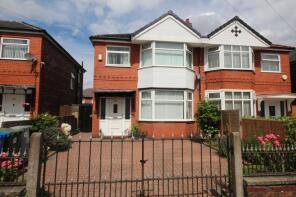
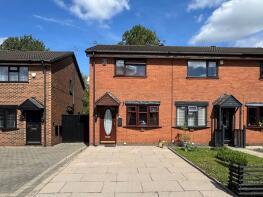
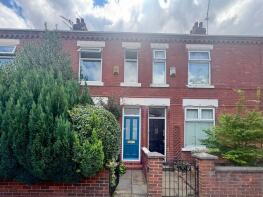
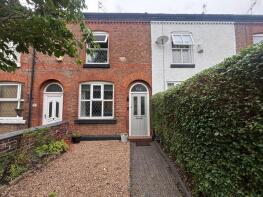
The majority of properties sold in Clarke Ind Est during the last year were terraced properties, selling for an average price of £298,681. Semi-detached properties sold for an average of £320,795, with flats fetching £196,921.
Overall, the historical sold prices in Clarke Ind Est over the last year were 6% up on the previous year and 6% up on the 2023 peak of £269,932.
Properties Sold
44, Marlborough Road, Manchester M32 0AN

| Today | See what it's worth now |
| 15 Dec 2025 | £325,000 |
| 5 Jul 2013 | £143,000 |
60, Marlborough Road, Manchester M32 0AN
| Today | See what it's worth now |
| 1 Dec 2025 | £314,500 |
| 27 Sep 2013 | £140,500 |
No other historical records.
19, Stephenson Road, Manchester M32 0SP
| Today | See what it's worth now |
| 28 Nov 2025 | £275,000 |
| 12 Oct 2001 | £64,000 |
No other historical records.
23, Norway Street, Manchester M32 0JN
| Today | See what it's worth now |
| 27 Nov 2025 | £293,000 |
| 14 Dec 2018 | £180,000 |
No other historical records.
64, Trafford Grove, Manchester M32 8LW
| Today | See what it's worth now |
| 19 Nov 2025 | £271,000 |
| 18 Dec 2020 | £230,000 |
2, Moreton Avenue, Manchester M32 8BP
| Today | See what it's worth now |
| 17 Nov 2025 | £445,000 |
| 31 Aug 2021 | £345,000 |
No other historical records.
6, Ashover Street, Manchester M32 0HG
| Today | See what it's worth now |
| 14 Nov 2025 | £210,000 |
| 6 Nov 2020 | £178,000 |
Apartment 47, 3, New Belvedere Close, Manchester M32 0EG

| Today | See what it's worth now |
| 3 Nov 2025 | £155,000 |
| 30 Jul 2004 | £131,500 |
No other historical records.
35, Cavendish Road, Stretford M32 0PS
| Today | See what it's worth now |
| 31 Oct 2025 | £275,000 |
No other historical records.
16, Smeaton Close, Manchester M32 0SY
| Today | See what it's worth now |
| 28 Oct 2025 | £292,500 |
| 1 Apr 2015 | £172,000 |
8, Darley Street, Manchester M32 0PW
| Today | See what it's worth now |
| 22 Oct 2025 | £248,500 |
| 3 Aug 2012 | £88,000 |
No other historical records.
55, Norway Street, Manchester M32 0JN
| Today | See what it's worth now |
| 17 Oct 2025 | £297,600 |
| 28 Feb 2019 | £170,000 |
No other historical records.
16, Lee Crescent, Manchester M32 0TW
| Today | See what it's worth now |
| 10 Oct 2025 | £340,000 |
| 24 Sep 1998 | £45,000 |
No other historical records.
Apartment 12, 28, Enriqueta Rylands Close, Manchester M32 0GW

| Today | See what it's worth now |
| 7 Oct 2025 | £242,500 |
| 27 Sep 2021 | £190,000 |
No other historical records.
Apartment 28, 1 Hatysa House, Emmeline Pankhurst Drive, Manchester M32 0GU

| Today | See what it's worth now |
| 6 Oct 2025 | £250,000 |
| 19 May 2023 | £223,000 |
No other historical records.
25, Stanway Street, Manchester M32 0JL
| Today | See what it's worth now |
| 3 Oct 2025 | £258,000 |
| 5 Mar 2021 | £212,000 |
13, Ashover Street, Manchester M32 0HG
| Today | See what it's worth now |
| 2 Oct 2025 | £198,750 |
| 11 Jun 2004 | £85,000 |
43, Norway Street, Manchester M32 0JN
| Today | See what it's worth now |
| 1 Oct 2025 | £281,144 |
| 27 Jun 2003 | £87,000 |
11, Dearne Drive, Manchester M32 0JU
| Today | See what it's worth now |
| 30 Sep 2025 | £286,000 |
| 18 Jun 2021 | £230,000 |
8, Dearne Drive, Manchester M32 0JU


| Today | See what it's worth now |
| 30 Sep 2025 | £320,000 |
| 19 Mar 1999 | £68,000 |
No other historical records.
7, Marland Way, Manchester M32 0NP

| Today | See what it's worth now |
| 26 Sep 2025 | £375,000 |
| 4 Jul 2003 | £181,995 |
No other historical records.
39, Moreton Avenue, Manchester M32 8BQ
| Today | See what it's worth now |
| 26 Sep 2025 | £375,000 |
| 17 Jun 2004 | £149,000 |
39, 2, New Belvedere Close, Manchester M32 0EG
| Today | See what it's worth now |
| 22 Sep 2025 | £162,500 |
| 16 Mar 2012 | £93,000 |
Apartment 7, 313, Talbot Road, Manchester M32 0FH

| Today | See what it's worth now |
| 19 Sep 2025 | £195,000 |
| 6 Dec 2022 | £167,500 |
No other historical records.
Apartment 3, 28, Enriqueta Rylands Close, Manchester M32 0GW

| Today | See what it's worth now |
| 12 Sep 2025 | £242,500 |
| 27 Aug 2021 | £185,000 |
No other historical records.
Source Acknowledgement: © Crown copyright. England and Wales house price data is publicly available information produced by the HM Land Registry.This material was last updated on 4 February 2026. It covers the period from 1 January 1995 to 24 December 2025 and contains property transactions which have been registered during that period. Contains HM Land Registry data © Crown copyright and database right 2026. This data is licensed under the Open Government Licence v3.0.
Disclaimer: Rightmove.co.uk provides this HM Land Registry data "as is". The burden for fitness of the data relies completely with the user and is provided for informational purposes only. No warranty, express or implied, is given relating to the accuracy of content of the HM Land Registry data and Rightmove does not accept any liability for error or omission. If you have found an error with the data or need further information please contact HM Land Registry.
Permitted Use: Viewers of this Information are granted permission to access this Crown copyright material and to download it onto electronic, magnetic, optical or similar storage media provided that such activities are for private research, study or in-house use only. Any other use of the material requires the formal written permission of Land Registry which can be requested from us, and is subject to an additional licence and associated charge.
Map data ©OpenStreetMap contributors.
Rightmove takes no liability for your use of, or reliance on, Rightmove's Instant Valuation due to the limitations of our tracking tool listed here. Use of this tool is taken entirely at your own risk. All rights reserved.